Alerting Systems are Incompatible with Modern Public Health Data Monitoring

Insights from public health data can keep communities safe. However, identifying these insights in large volumes of modern public health data can be laborious1. As a result, over the past few decades, public health agencies have built monitoring systems, like ESSENCE (CDC) and DHIS2 (WHO), where users can set custom statistical alerts and then investigate these alerts using data visualizations2. These alerting systems largely follow the following formula3 as shown in Fig 1.:
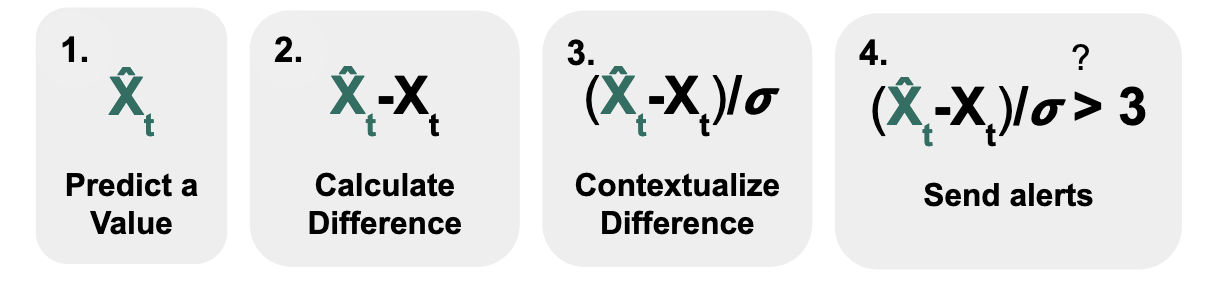
- Predict a value that you expect the data to have
- Calculate the difference between your observed and predicted values
- Contextualize the difference (e.g., to account for variability in the data)
- Send alerts when this value passes a threshold
Using this formula, if we assume that our data follows the bell curve of a normal distribution, we can calculate the difference between our prediction (which might be the average of the data) and what we observe, and divide by the standard deviation. If this value exceeds a specific threshold (here, we use 3), then the probability that we would observe that data point in that bell curve would small (here, it’s less than 1%), which means that it is quite surprising. By setting this threshold high, only a small percentage of points are identified as outliers and thus result in alerts.
This was the same intuition we used while initially designing Delphi’s data monitoring system at the pandemic’s start. This monitoring system was particularly important because Delphi’s stakeholders wanted to be aware of any events in the data - like changes in data quality or disease dynamics. First, we split these events into data validation (e.g., negative cases) and events that needed a human-facing statistical alert (using the above formula) so that an expert could ultimately interpret and classify the event.
However, we quickly realized this formula did not work with Delphi’s large data volume. To illustrate: creating alerts for 1% of the data over millions of data points, like those analyzed by Delphi, results in 10,000+ alerts - far too many for us at Delphi to inspect and investigate! Standard correction approaches were also incompatible with public health data. Our first attempt was reducing the percentage of alerts (e.g., changing thresholds that would identify the data as alerts from 1% to 0.01%). However, because modeling public health data is difficult, defining thresholds (e.g., 1 in 10000) when data streams only have a few hundred historical data points can be somewhat arbitrary. Additionally, when applying the same standard threshold-generating function across all the data (adaptive thresholds), we missed some important events from signals that were not well-calibrated to the function. Tuning these parameters by hand across hundreds of signals was tedious, and Delphi turned off the outlier alerting system.
The historical alerting framework cannot keep up with monitoring the increasingly large volumes of heterogeneous public health data that organizations like Delphi process. Delphi has increased its volume by 1000x in the past three years alone. And, although Delphi processes data from several geographical regions, even local public health agencies who use systems (that focus on one geography) under the existing alerting framework have challenged its usefulness (e.g. “What Can You Really Do with 35,000 Statistical Alerts a Week Anyways?” (2019)). We anticipate this failure mode for alerting systems will become more prevalent as data volumes grow.
Bridging the gap with FlaSH
Identifying and communicating noteworthy events from public health data is a critical step for future pandemic prevention4. But how should we redesign our event detection process? After reflecting on our prior system, we realized the reason why existing monitoring fails is best summarized by the following quote:
“The current disconnect among algorithm developers, implementers, and [experts] … foster[s] distrust in statistical monitoring and in biosurveillance itself.” - Galit Shmeuli & Howard Burkom5
Interestingly, through our prior system, I had the opportunity to experience all three roles, from developing the outlier detection methods, implementing and deploying the methods over Delphi’s data, and then analyzing the outputs of the methods. These three roles came with different constraints and priorities. These experiences set the foundation for devising an interdisciplinary approach.
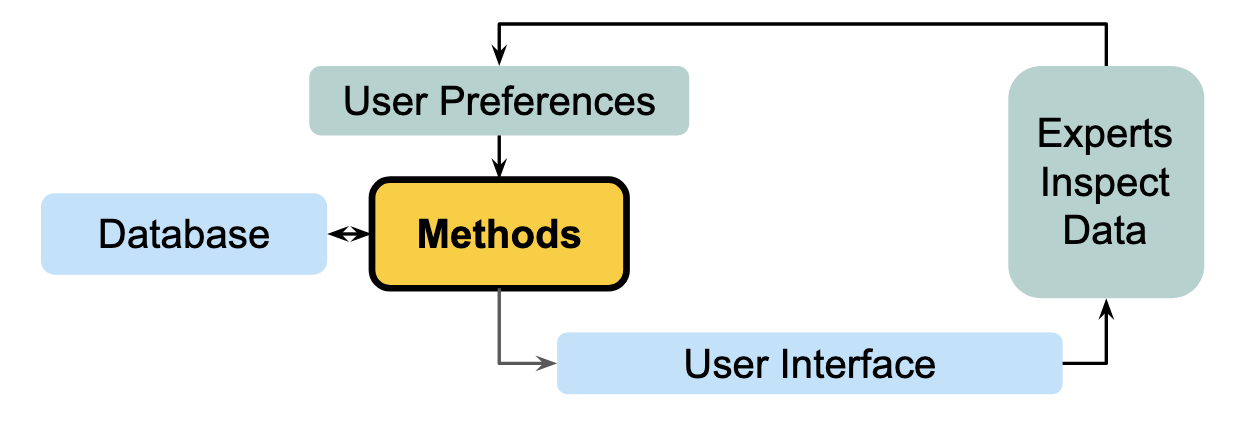
Combining the methods, engineering, and quality assurance perspectives for event detection from large-scale public health streams, we developed a human-in-the-loop approach to address some fundamental challenges in existing alerting systems. Namely, we rank Delphi’s recently updated data by how much it warrants reviewer attention. Reviewers can then decide how many data points they want to investigate, which prioritizes a reviewer’s time and does not expect them to review a certain number of alerts flagged via some arbitrary threshold.
Here’s a quick illustration of why the ranking approach works. The most limited resource in this setting is an expert reviewer’s time and attention. We want to show this reviewer as many potential events as possible so that they can interpret the data with their known context.
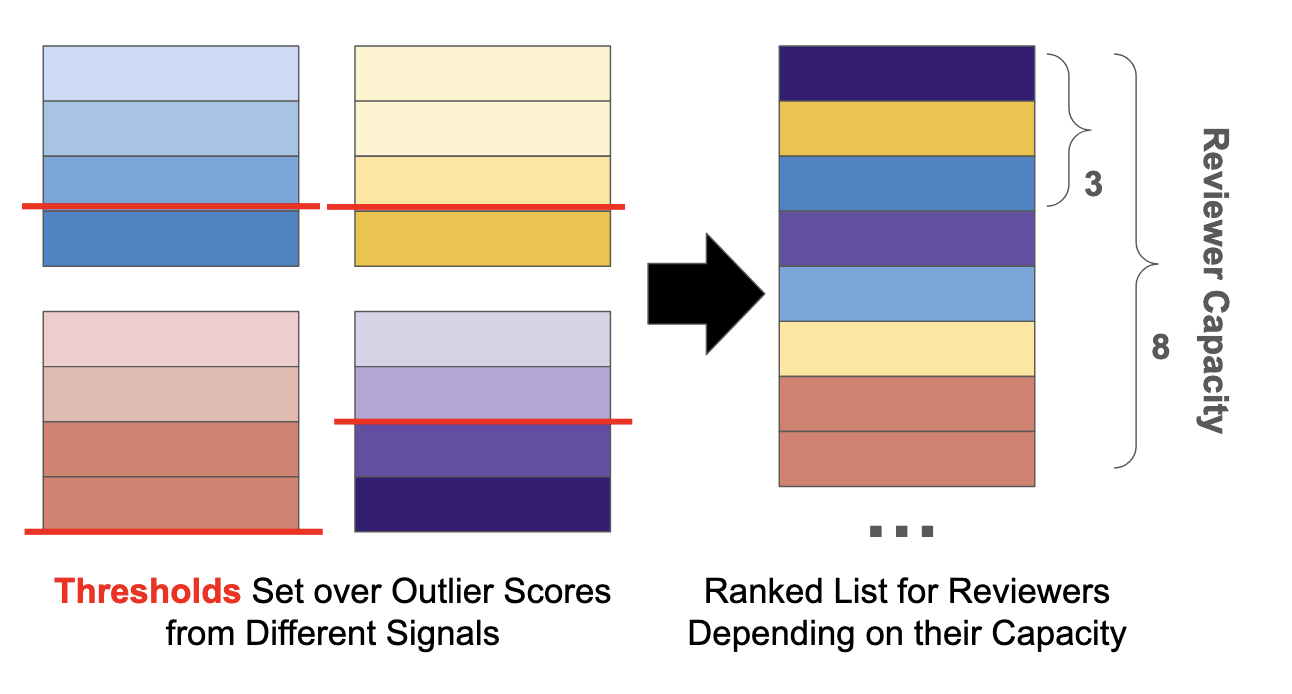
Now imagine each data point per signal was given an outlier score, and there is an arbitrary threshold where scores higher than that threshold are considered outliers. If we develop granular enough rankings, we can directly compare outlier points between different signals without arbitrary thresholds. Then, our data reviewer can focus on data points in their order of importance and stop the review at any time.
Developing this framework required new methods, visualizations, and evaluations. Over the past few years, our goal as part of the FlaSH team was to implement and iterate on this framework. We’re excited to share insights from these perspectives as we’ve moved FlaSH from a sandboxed research project to a deployed part of Delphi’s systems that helps our users. For the next post in this series, I’ll describe some of the novel methods we use to rank events in large volumes of public health data. Then, Richa Gadgil and Nolan Gormley will share their thoughts on moving these research prototypes into a production environment. Third, Tina Townes and Catalina Vajiac will describe the data visualization and quality assurance processes and considerations they encountered while facilitating event detection investigation. Beyond that, we’ll share updates on how we work towards tightening the human-in-the-loop process!
This blog post includes material from my thesis proposal, “Identifying Anomalous Events in Modern Public Health Data Streams”
This work was supported by the Centers for Disease Control and Prevention of the U.S. Department of Health and Human Services (HHS) as part of a cooperative agreement funded solely by CDC/HHS under federal award identification number U01IP001121, “Delphi Influenza Forecasting Center of Excellence”; and by CDC funded contract number 75D30123C15907, “Digital Public Health Surveillance for the 21st Century”. The contents are those of the authors and do not necessarily represent the official views of, nor an endorsement by, CDC/HHS or the U.S. Government. Additionally, this material is based upon work supported by the National Science Foundation Graduate Research Fellowship under Grant No. DGE1745016 and DGE2140739. Any opinion, findings, and conclusions or recommendations expressed in this material are those of the authors and do not necessarily reflect the views of the National Science Foundation.
Rosen, George. A history of public health. JHU Press, 2015.↩︎
Chen, Hsinchun, Daniel Zeng, and Ping Yan. Infectious disease informatics: syndromic surveillance for public health and biodefense. Vol. 21. New York: Springer, 2010.↩︎
Murphy, Sean Patrick, and Howard Burkom. “Recombinant temporal aberration detection algorithms for enhanced biosurveillance.” Journal of the American Medical Informatics Association 15.1 (2008): 77-86.↩︎
“Rapidly Detecting and Responding to Health Emergencies.” World Health Organization, https://www.who.int/activities/rapidly-detecting-and-responding-to-health-emergencies. Accessed 29 Jan. 2024.↩︎
Shmueli, Galit, and Howard Burkom. “Statistical challenges facing early outbreak detection in biosurveillance.” Technometrics 52.1 (2010): 39-51.↩︎
Acknowledgements: Thank you to George Haff, Carlyn Van Dyke, and Ron Lunde for editing this blog post.


