Identifying Changing Variant Behavior during a Pandemic: An Exploratory Analysis

Introduction
In November 2021, less than eighteen months after the first emergence of COVID-19, the National Institute for Communicable Diseases (NICD) in South Africa announced a new COVID-19 variant. Scientists subsequently discovered that the transmission, hospitalization, and mortality rates of the virus variant, known as the Delta variant, differed from the Original pandemic strain1. Methods that can detect these changes in underlying distributions of values in public health indicators (like cases, hospitalizations and deaths) can be useful in identifying changing health dynamics, like an emerging virus variant. We specifically use a technique called changepoint detection to analyze the power of Delphi’s historically available indicators to identify changes in COVID-19 variant behavior between January 30, 2021 and September 17, 20222.
Establishing National Ground Truth Changepoints
To establish when the composition of different COVID-19 variants changed, we used three changepoint detection algorithms: PELT, Binary Segmentation, and Bottom-up Segmentation on Delphi’s national JHU-CSSE COVID-19 Cases stream3.This stream was the smoothed 7-day average of the number of new confirmed COVID-19 cases (for all variants) in the United States (US). After aggregating the changepoints at a weekly level, we marked the weeks where all three methods agreed for the national cases data stream (Fig. 1). To corroborate these points, we also used the CDC’s COVID Data Tracker, which reports the ratio of different COVID-19 sub-variant variants among the infected US population. We combine the different sub-strains of COVID in the data to represent the three dominant variants: “Original,” “Delta,” and “Omicron.” These changes in variant makeup visually match the ground truth changepoints from the national signal, as seen in Figure 1.
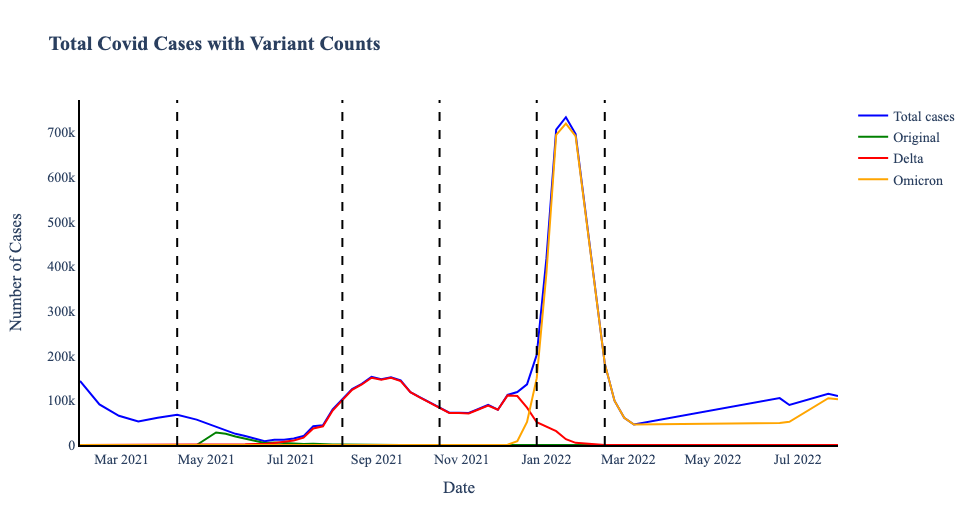
Figure 1. Total and Variant Case Counts with variant changepoints on April 24, 2021; June 19, 2021; December 18, 2021; March 5, 2022; June 18, 2022.
Methods
Next, we needed to identify how these ground truth changepoints compared to changepoints in indicators (using the same three algorithms). We used all available data streams during our selected time range from Delphi’s COVIDCast database, which corresponds to 60 indicators (including the Facebook survey, Google Search, claims, hospitalization, and mortality indicators), each at the state/territory and national tier. When we aggregated the calculated changepoints per indicator per week, as Fig. 2 shows, we identified that some weeks have many more changepoints than others. To match the number of ground truth changepoints, we filter to the top 5 weeks per indicator (major indicator changepoints) to directly compare with the ground truth changepoints.
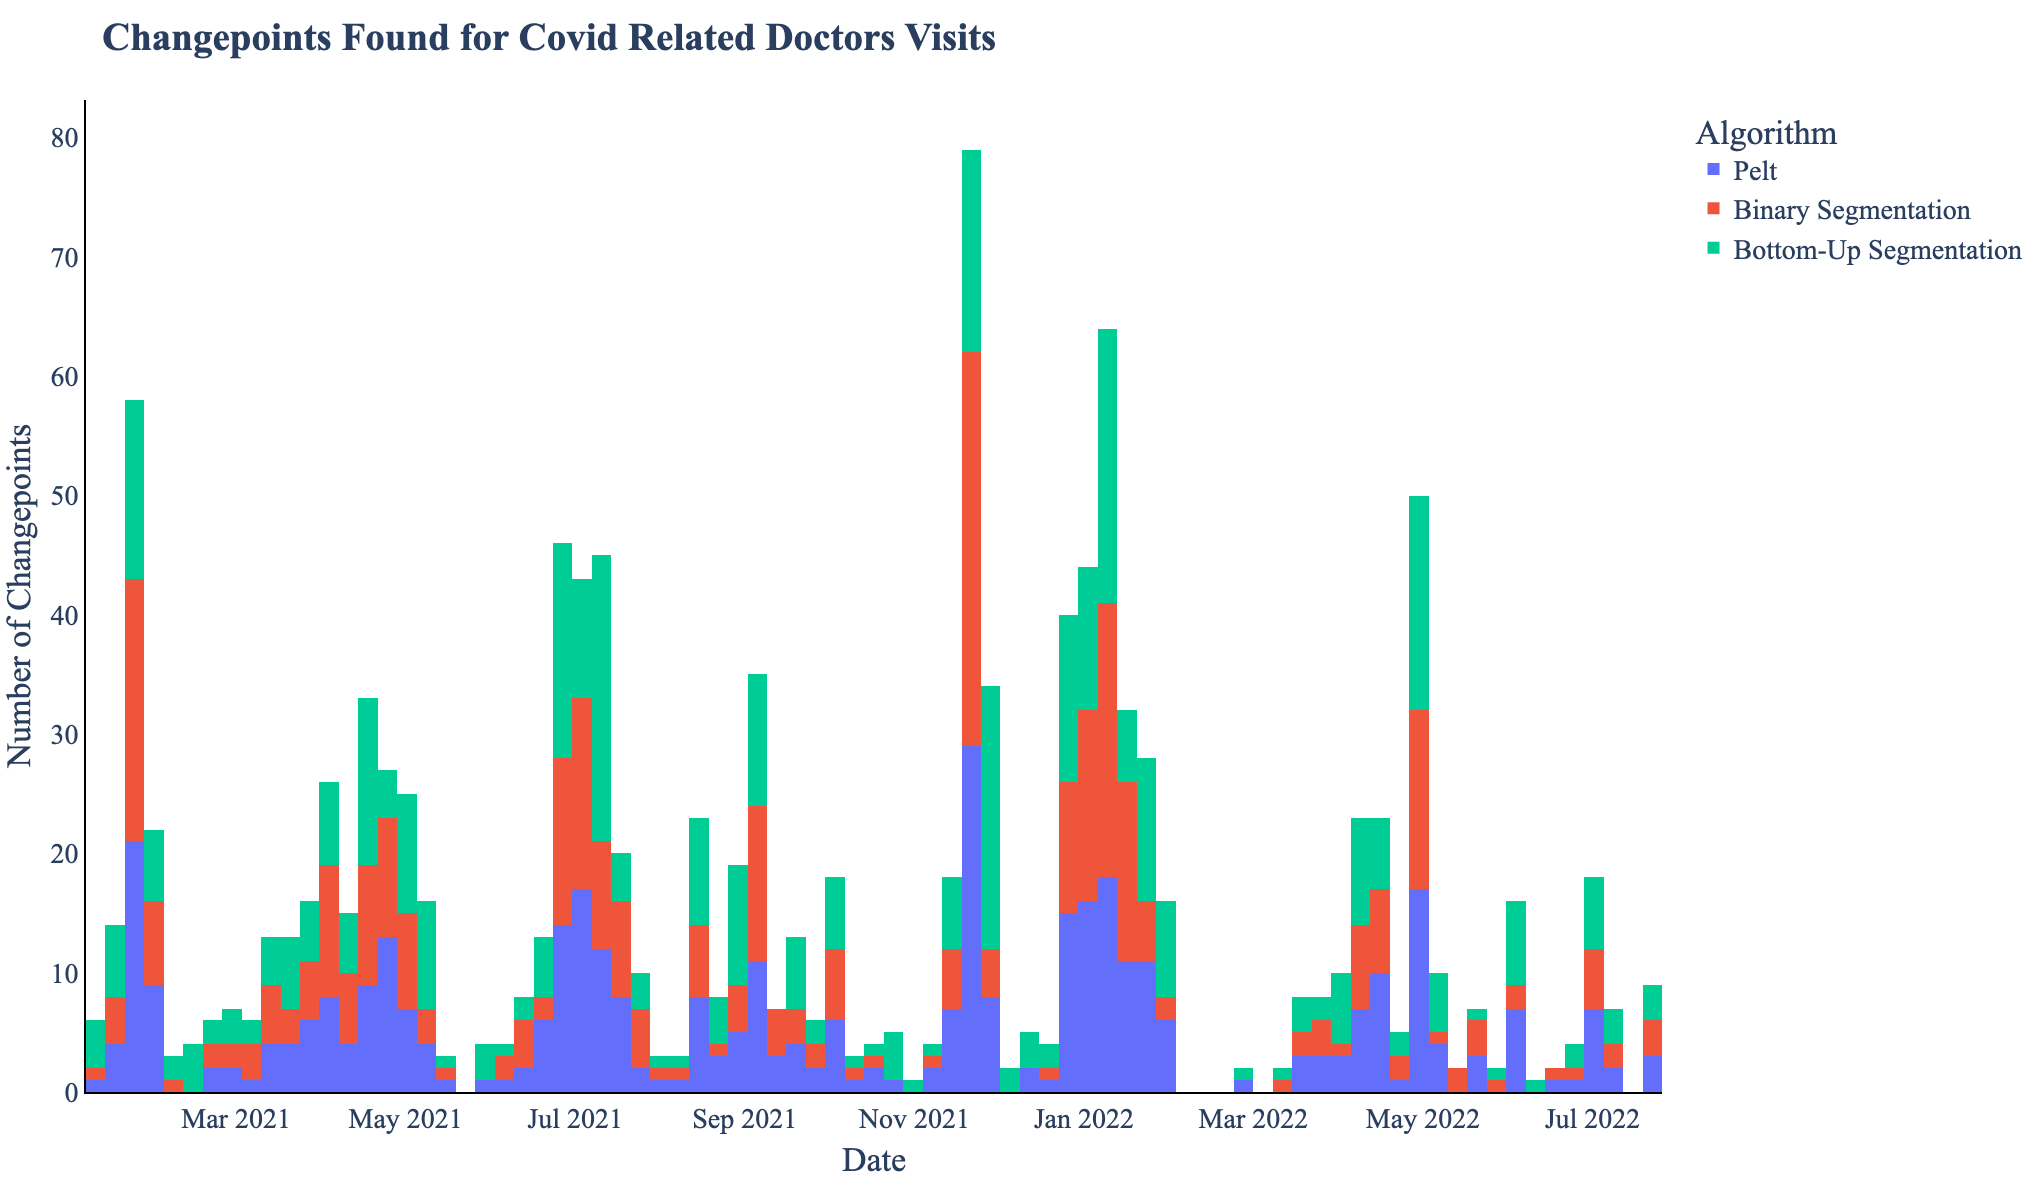
Figure 2. The aggregated count of changepoints per week in all fifty two regions by all three algorithms for estimated COVID related outpatient doctor visits
Then, we categorized indicators as early, on-time, or late using the following definitions:
- Early: The five major indicator changepoints consistently precede the ground truth changepoints.
- On-time: The major indicator changepoints appear within a week of the ground truth changepoints
- Late: The major indicator changepoints lag behind the ground truth changepoints by more than a week.
As we expect COVID dynamics (like waves) to last around four weeks, if any major indicator changepoint is more than 28 days away from the nearest ground truth changepoint, it is likely a changepoint from an unrelated phenomena. Therefore, we only consider changepoints to have a leading or lagging relationship if the major indicator changepoint is within 28 days from a ground truth changepoint.
Results and Analysis
In total, of the sixty indicators, 4 were early, 8 were on time, and 12 were late. There was also 1 undetermined indicator and 35 indicators whose major indicator changepoints had inconsistent relationships with the ground truth changepoints. Some indicators in this inconsistent category started out as early indicators and ended as late indicators, while others started as late indicators but ended as on time indicators, showing that indicators may not always be consistently early, on time, or late. Interestingly, indicators from the same source were usually classified similarly, suggesting that indicator timeliness depends heavily on the data provider. Still, while there was some variance in the leading nature of early indicators, other categories had much less variance.
| Classification | # of Indicators | 95% CI for Leadingness (in days)Using Range of 28 days |
|---|---|---|
| Early | 4 | 13.125±5.54 |
| On time | 12 | 1.55±1.69 |
| Late | 8 | -14.62±1.6 |
| Undetermined | 1 | 28 |
| Variable | 35 | 1.13±2.13 |
Early Indicators: Early indicators are the most important in identifying changing health dynamics. For example, the majority (6/8) of indicators from Google Symptoms are early indicators, especially indicators related to fevers. In Fig 3. we see one example of Google Symptoms early indicator (which includes searches for Fever, Hyperthermia, Chills, Shivering, and Low grade fever), where the major indicator changepoints lead ground truth changepoints by approximately one week.
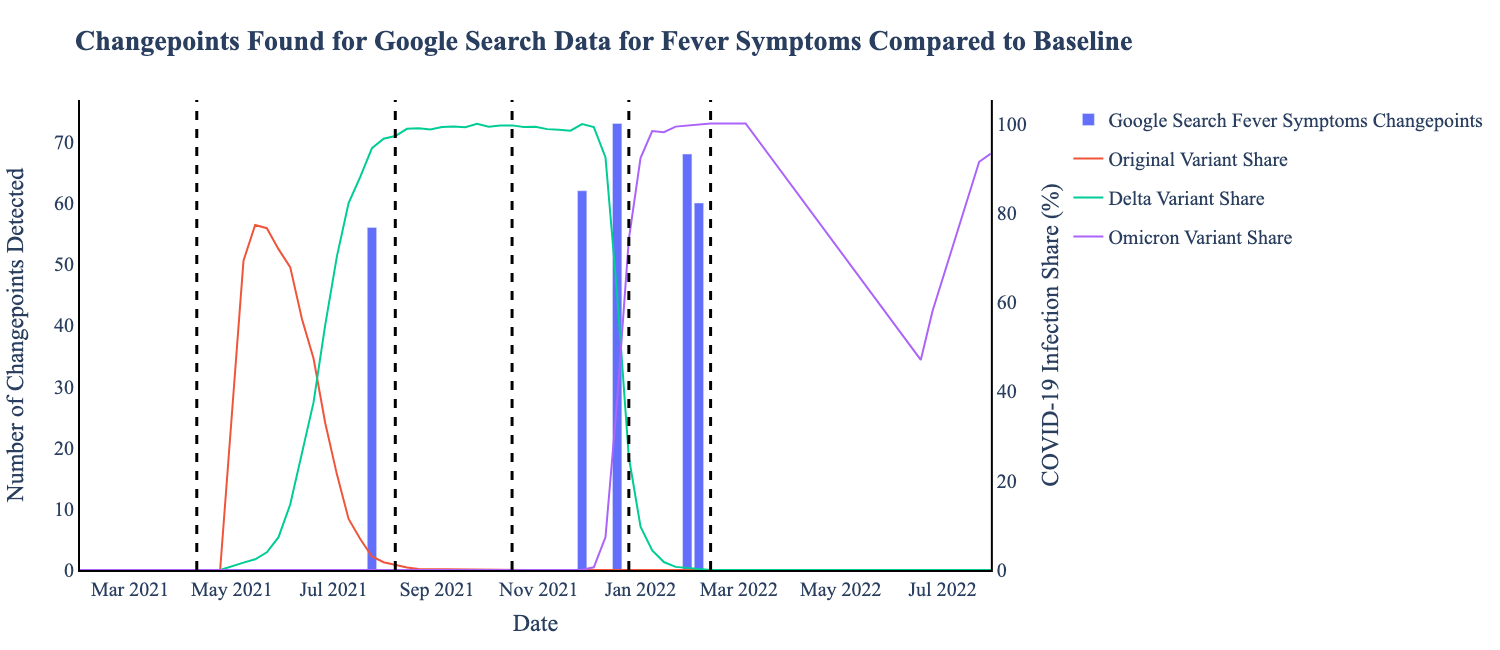
Figure 3. This early indicator has major indicator changepoints (blue bars) which occur a week or more before the ground truth changepoints (black line). This data is sourced from Google Symptoms and shows search data for keywords “Fever, Hyperthermia, Chills, Shivering, Low grade fever”
On-time Indicators: On-time indicators (Fig. 4) most frequently correspond to data involving insurance claims, suspected COVID cases among hospital admissions, and, unsurprisingly, other COVID-19 incidence data reports from JHU-CSSE. Other notable early or on-time indicators include: the number of doctors visits for cases with COVID or COVID-like symptoms, Data Strategy and Execution Workgroup Community Profile Report (CPR) data on the number of people who were fully vaccinated.
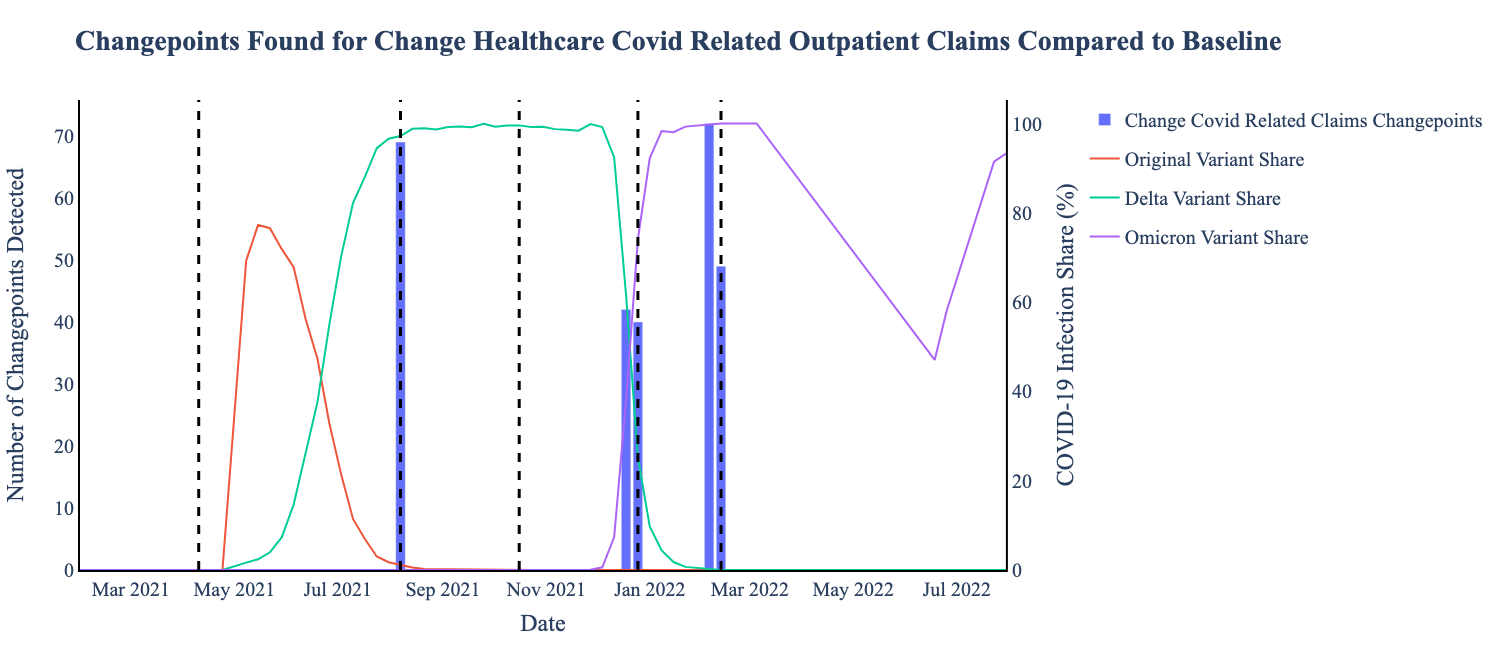
Figure 4. This on-time indicator has major indicator changepoints (blue bars) which occur within a two week window around the ground truth changepoints (black).
Variable Indicators: Variable indicators are perhaps the most interesting set of indicators. For most of the available range, the JHU-CSSE new confirmed COVID-19 cases daily indicator was early, but the last changepoint was late. Many other JHU-CSSE indicators follow this pattern. Another example is the Google Symptom Search data related to smell and taste loss, specifically, “Anosmia, Dysgeusia, Ageusia.” In the figure below, we see the relationship between the indicator’s major changepoints and the ground truth change from early in the first ground truth changepoint to late in the middle of the pandemic, and then early again for the rest of the ground truth changepoints.
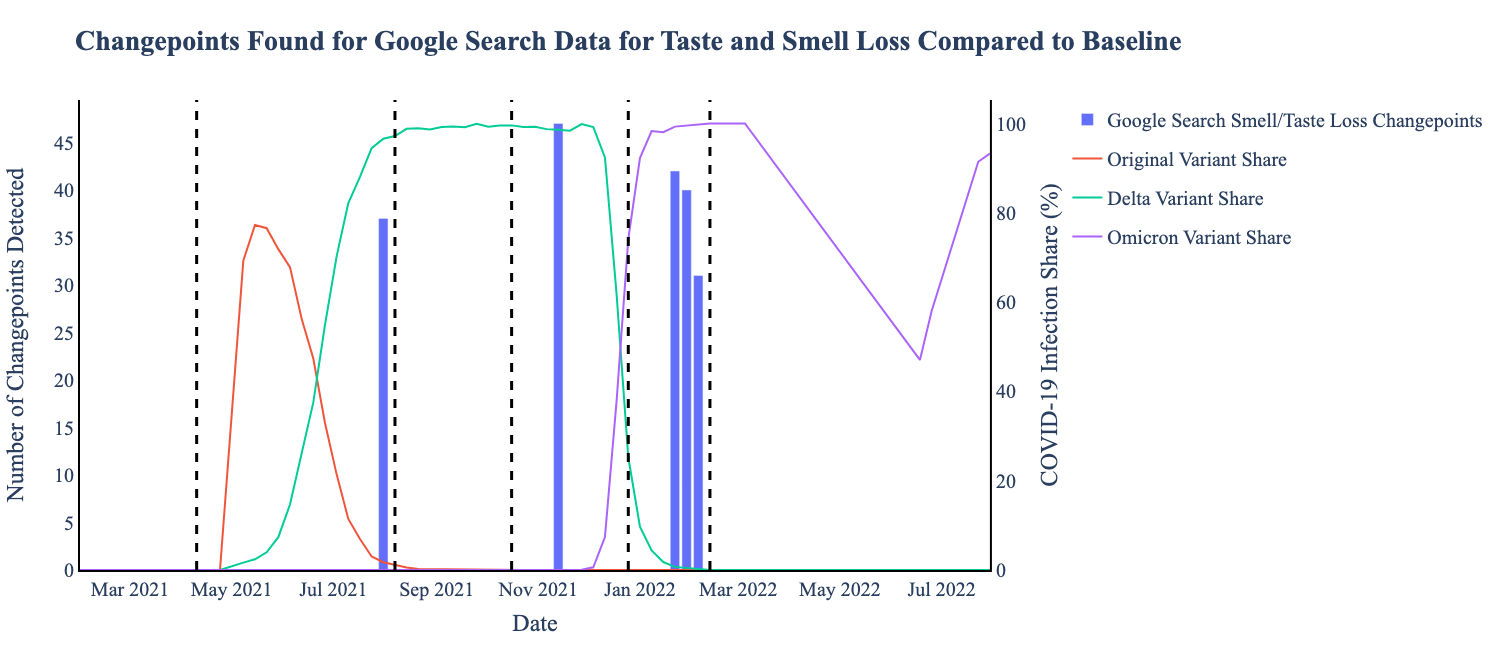
Figure 5. This variable indicator has changepoints (blue bars) which occur early and late relative to the critical changepoints (black) established using CDC data.
Limitations and Discussion
Due to state level reporting inconsistencies, we could only analyze 60 out of 79 indicators available in the timespan investigated. Many of these indicators were missing data, like that the number of confirmed COVID-19 patients admitted to all hospitals in the state of Alaska was reported only five times within the 595 day search window. We also recognize that not all regions will be impacted by emerging variants at the same time in the same way and that a further detailed analysis which takes into account different impacts per region is an important avenue for future work.
Overall, Changepoint detection is a powerful tool to identify early indicators. Of Delphi’s sixty indicators, we identified several on time and early indicators of emerging variants from the data available. We also found out that for many of the indicators, the number of days they led or lagged disease phenomena changed over time. Still, if these public health indicators continue to receive high quality data, tracking these indicators closely can help us identify changing health dynamics.
The python notebook used for this analysis can be found on Github here.
This work was supported by the Centers for Disease Control and Prevention of the U.S. Department of Health and Human Services (HHS) as part of a cooperative agreement funded solely by CDC/HHS under federal award identification number U01IP001121, “Delphi Influenza Forecasting Center of Excellence”; and by CDC funded contract number 75D30123C15907, “Digital Public Health Surveillance for the 21st Century”. The contents are those of the authors and do not necessarily represent the official views of, nor an endorsement by, CDC/HHS or the U.S. Government. Additionally, this material is based upon work supported by the National Science Foundation Graduate Research Fellowship under Grant No. DGE1745016 and DGE2140739. Any opinion, findings, and conclusions or recommendations expressed in this material are those of the authors and do not necessarily reflect the views of the National Science Foundation.
We refer to the “Original” variant as both Alpha and Beta variants because they emerged around the same time.↩︎
Range based on the data history available for many of the Delphi indicators↩︎
These methods do not require a set number of changepoints.↩︎


