COVID Vaccination Trends Among the Hispanic Community in the United States

Since December 2020, the COVID-19 Symptom Survey conducted by the Delphi Group at Carnegie Mellon University and Facebook has included questions about COVID-19 vaccination behaviors and attitudes. Using de-identified aggregate data including 2.8 million responses collected between January 10 and March 31, 2021, now available publicly, we examined vaccine hesitancy and obstacles to vaccination for Hispanic adults across the United States, and how their experiences differ from non-Hispanic adults.
Vaccine hesitancy among Hispanic adults has significantly decreased nationally; however, it remains high in midwestern and southeastern states. Nationally, vaccine hesitancy among Hispanic adults has decreased significantly (by 9.2 percentage points) between January and March 2021. This is greater than the decline observed among non-Hispanic White adults (4.9 percentage points). However, there is still a large state-to-state difference in vaccine hesitancy among Hispanic adults, and vaccine hesitancy remains the highest in several states (e.g. Alabama, Montana, Tennessee, Wyoming, and Ohio).
Hispanic adults are much more likely to be vaccine-hesitant than non-Hispanic White adults, and this mirrors gaps observed in vaccine uptake between Hispanic and White adults. This disparity in vaccine hesitancy by Hispanic ethnicity is especially high in Massachusetts, Washington, D.C., Connecticut, New Jersey, Colorado, and Montana. In several states, the large disparities in vaccine hesitancy mirror large disparities in vaccine uptake. For example, in Massachusetts and Connecticut, Hispanic adults are 70% more likely to be vaccine-hesitant and 50% less likely to be vaccinated compared to White adults. This suggests that addressing the gaps in vaccine hesitancy among unvaccinated adults may also help close the gap in vaccine uptake between Hispanic and White adults. Fortunately, the disparity in vaccine hesitancy in many of these states is either decreasing or stable over time.
There are several reasons for hesitancy that are given more frequently by Hispanic adults than White adults, including safety and cost. Among Hispanic adults, safety concerns and lack of confidence in vaccines remain the top reasons for hesitancy in most states. In states where Hispanic adults are much more likely to be vaccine-hesitant than White adults, Hispanic adults are more likely than White adults to indicate that they are hesitant due to many reasons, including safety concerns, lack of confidence in vaccines, cost, and religious beliefs or altruism. For example, in Michigan, 8.3% of Hispanic adults select cost as a reason for hesitancy vs. 3.1% of White adults, though federal law mandates that the vaccines be freely available to everyone, regardless of insurance status.
Hispanic adults feel less informed than White adults about how to get a vaccine. This finding is consistent across all states. Georgia and Kansas stand out as states that have one of the lowest proportion of Hispanic adults who feel informed (45%) and as states where Hispanic adults are much less likely than White adults to feel informed (30% less likely). States like Georgia and Kansas with large disparities by Hispanic ethnicity are also where Hispanic adults are much less likely than White adults to try to make a vaccination appointment (more on this below), highlighting the need to address potential information gaps and needs among Hispanic adults.
Hispanic adults are much less likely to have a vaccination appointment or have tried to make an appointment compared to White adults. Georgia and North Carolina stand out in particular because these states also have the lowest proportion of Hispanic adults who tried to make an appointment (24.8-26.9% compared to the national average of 31.8%), and Hispanic adults were much less likely to try than White adults (relative ratio of 0.7). This suggests that addressing vaccine hesitancy alone will not be sufficient to eliminate disparities in uptake between Hispanic and White adults, and that other approaches such as increasing availability of information about how to get a vaccine may be necessary, as noted above. It is also possible that, in addition to the information gap, immigration status may also be a barrier, given that these states have some of the largest unauthorized immigrant populations in the US.
Current state of vaccine hesitancy among the Hispanic population
During the week of March 21-27, 16.3% of Hispanic adults reported being vaccine-hesitant. This hesitancy rate is down 9.3 percentage points from early January, when it was 25.6%.
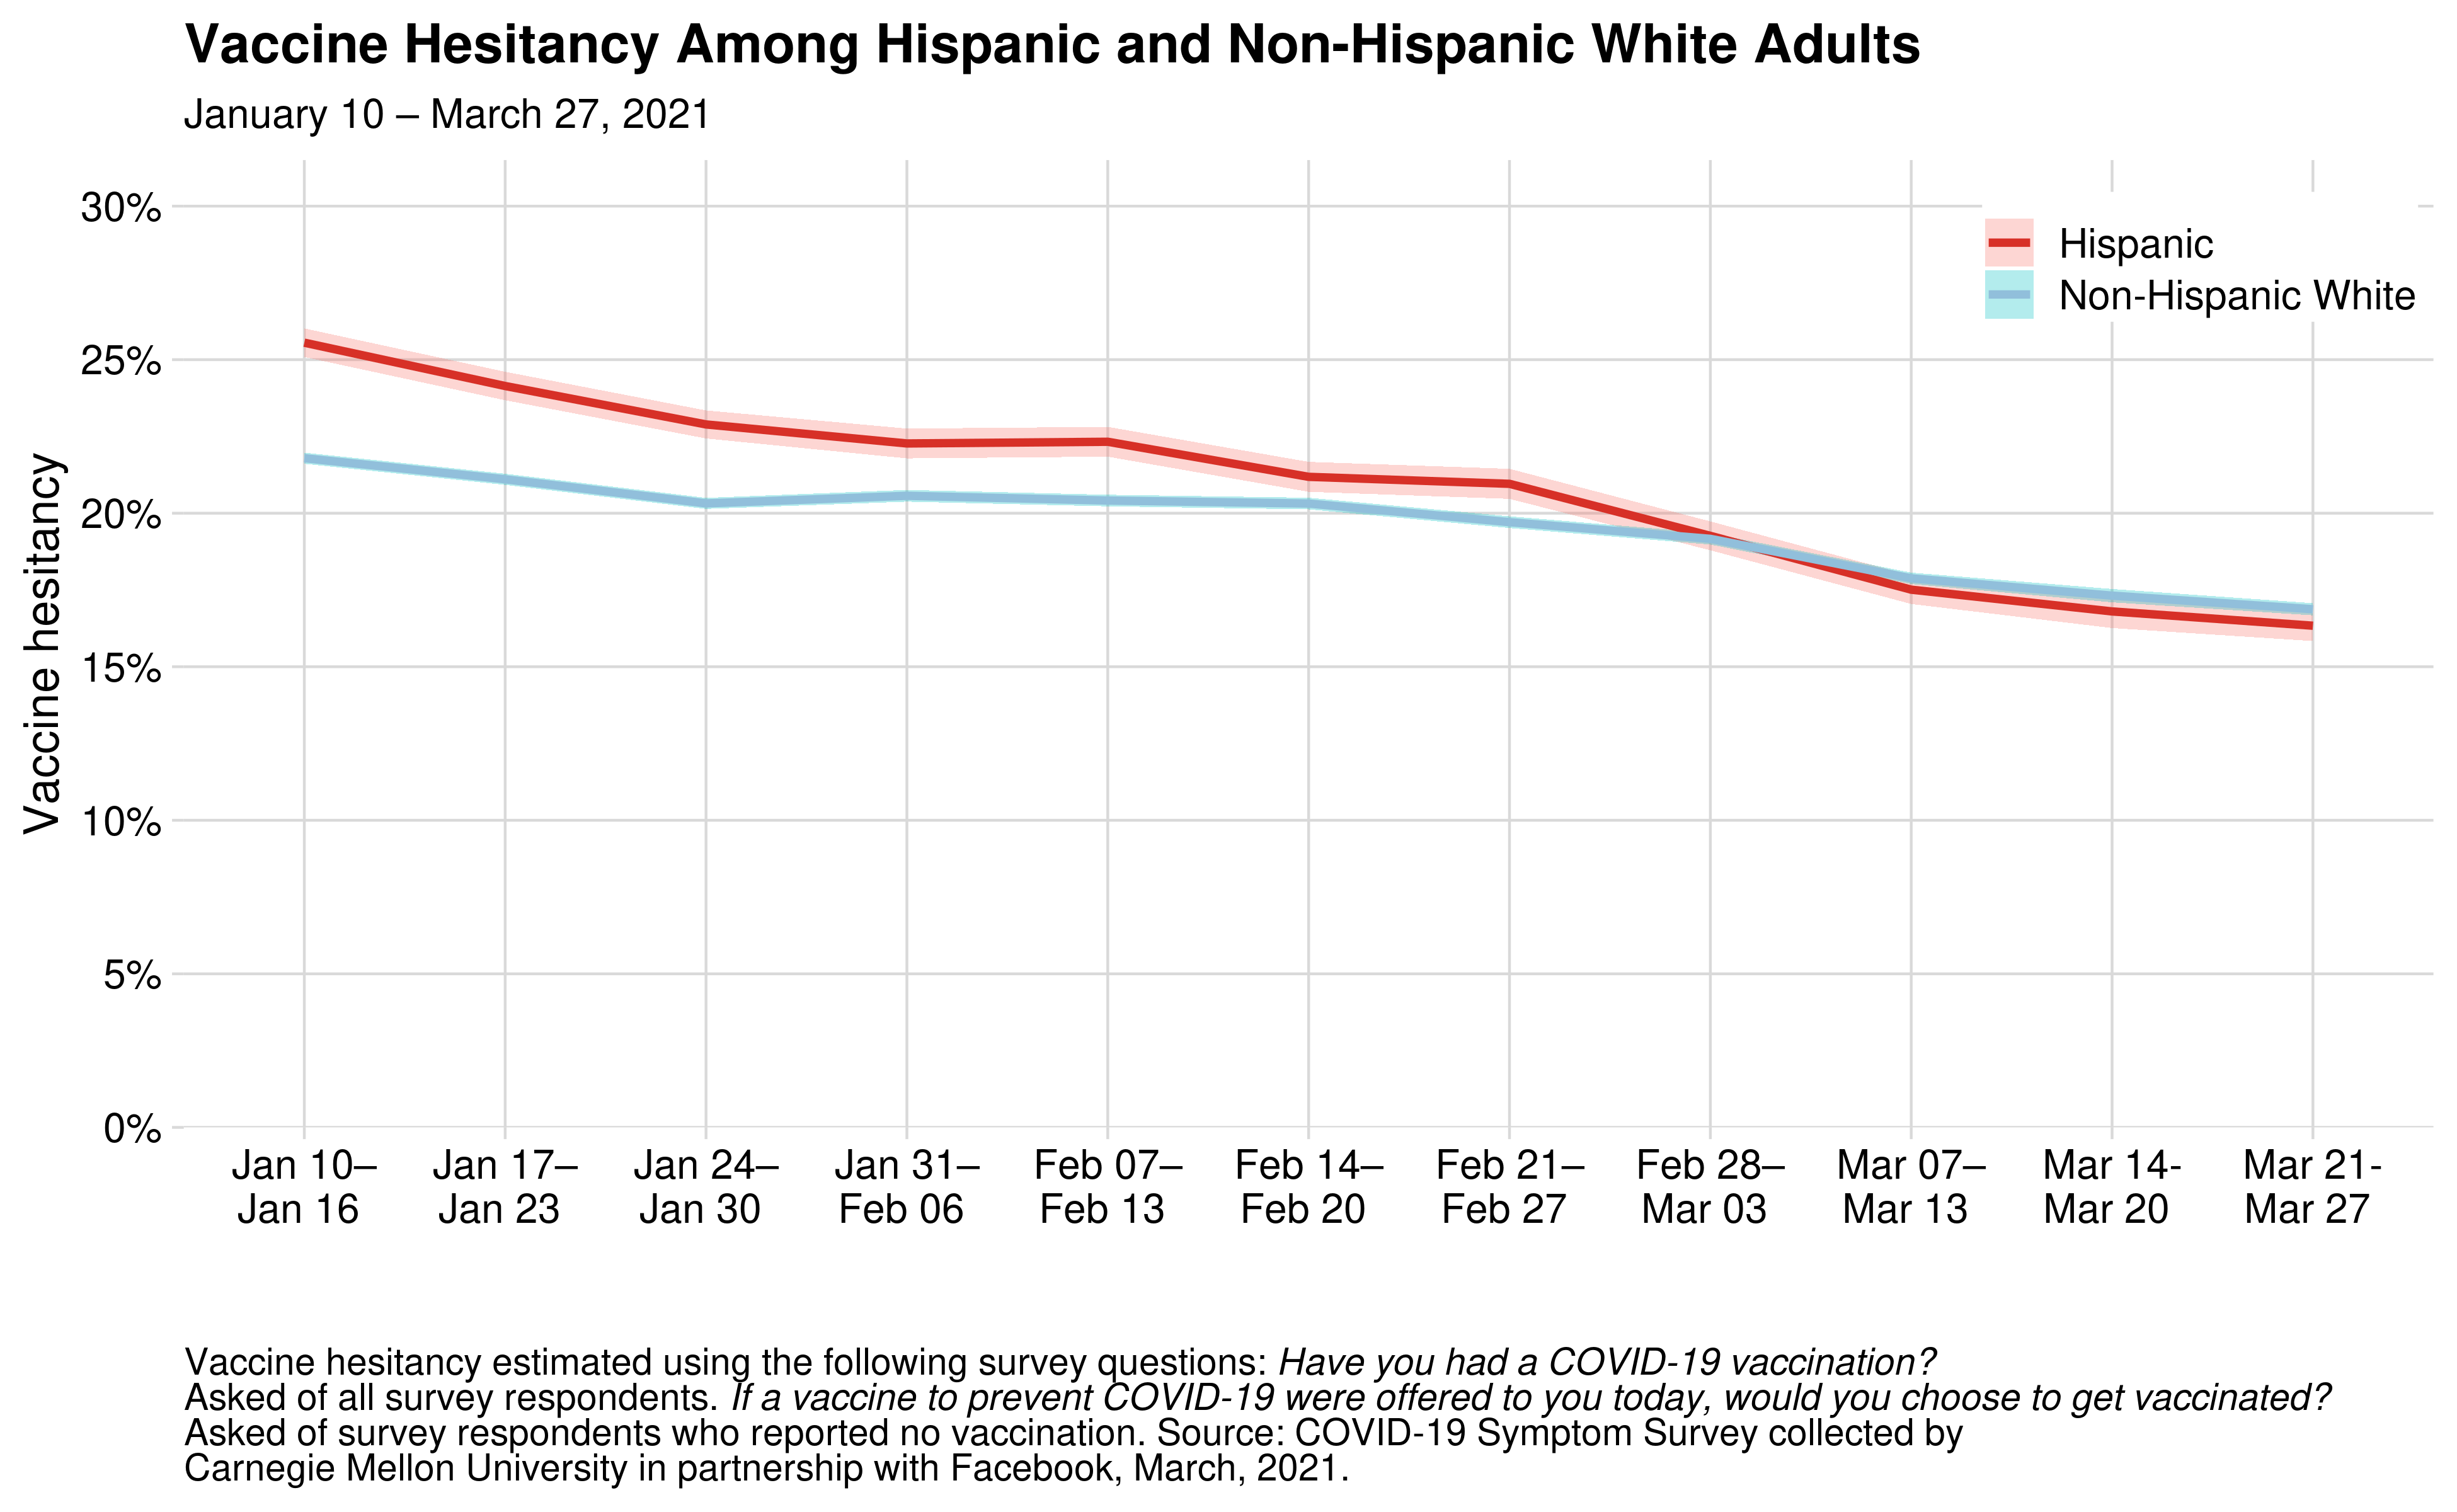
We can also see that since January, the initial 3.8 percentage point gap in vaccine hesitancy between Hispanic adults and non-Hispanic White adults has closed. Hesitancy rates among Hispanic adults are now similar to those among non-Hispanic White adults (16.9%).
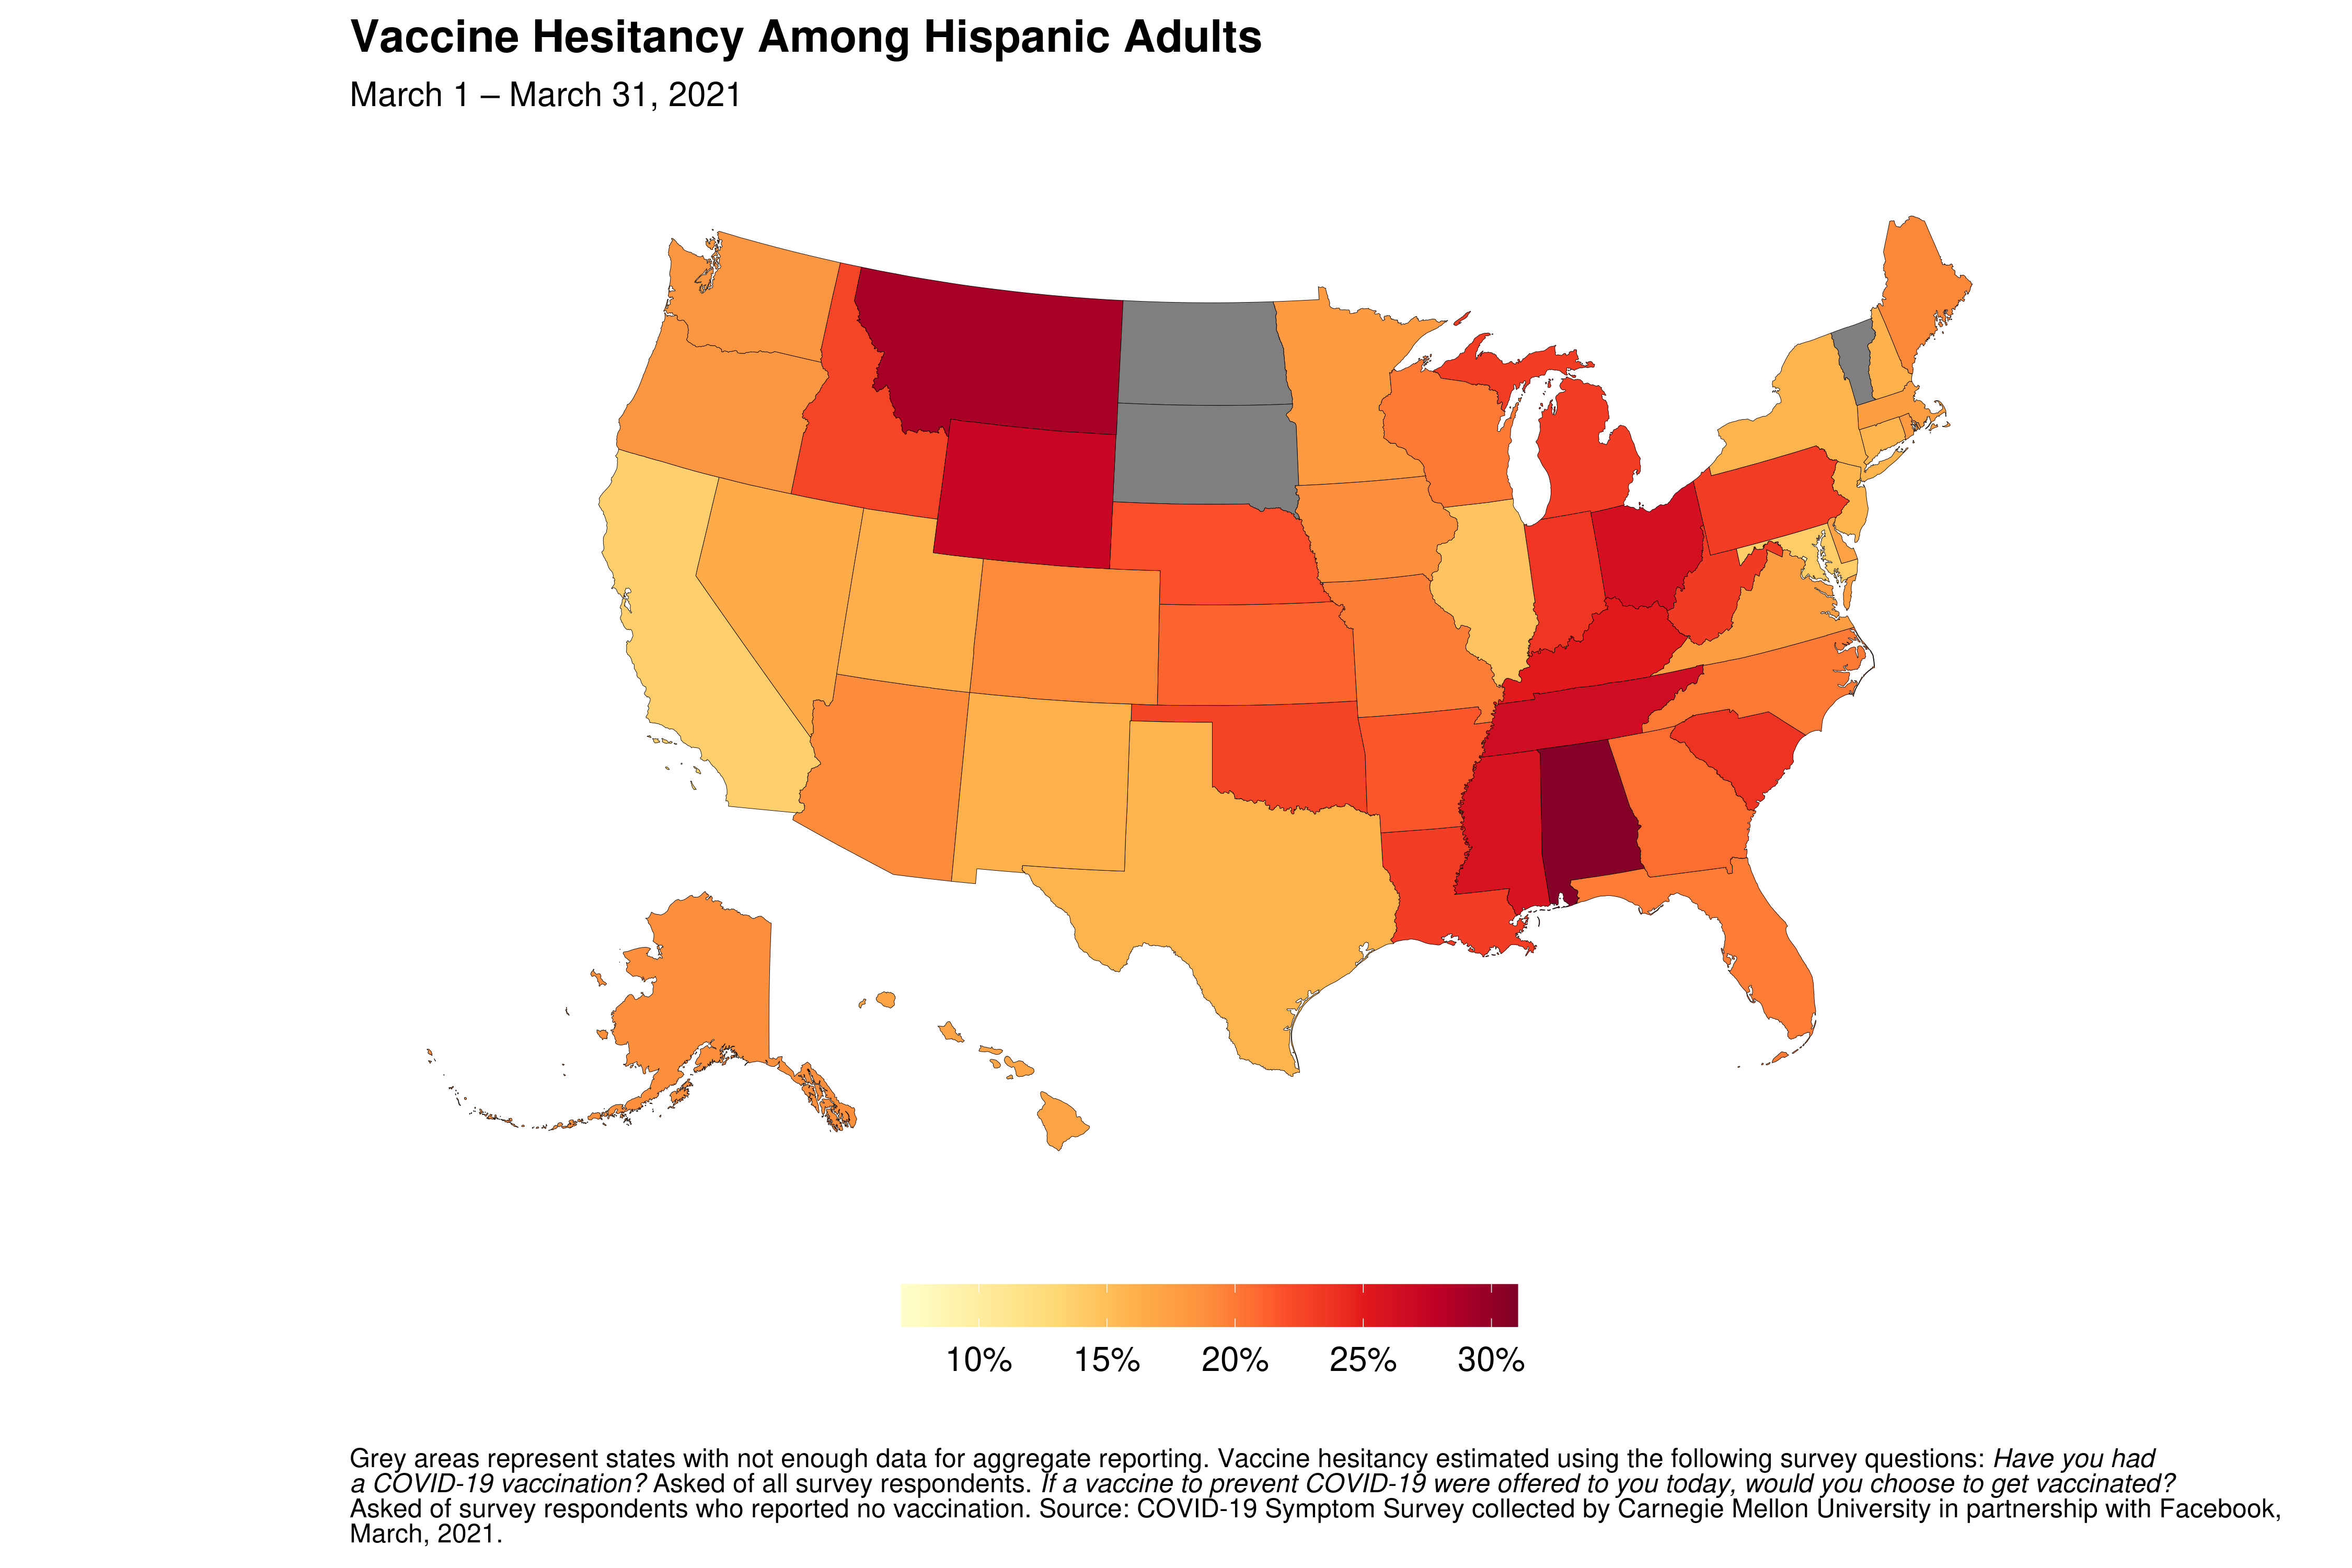
However, vaccine hesitancy among Hispanic adults continues to remain high in several states. AL (30.8%), TN (29.1%), OH (26.3%), MT (29.1%), and WY (27.3%) have the highest proportion of vaccine-hesitant Hispanic adults, while DC (7.2%), CA (13.7%), MD (14%), IL (14.6%), and CT (15.8%) have the lowest proportion of vaccine hesitancy among Hispanic adults:
Disparities in vaccine hesitancy between Hispanic and non-Hispanic White adults
Despite similar rates nationally, several states have a large disparity in vaccine hesitancy between Hispanic and non-Hispanic White adults:
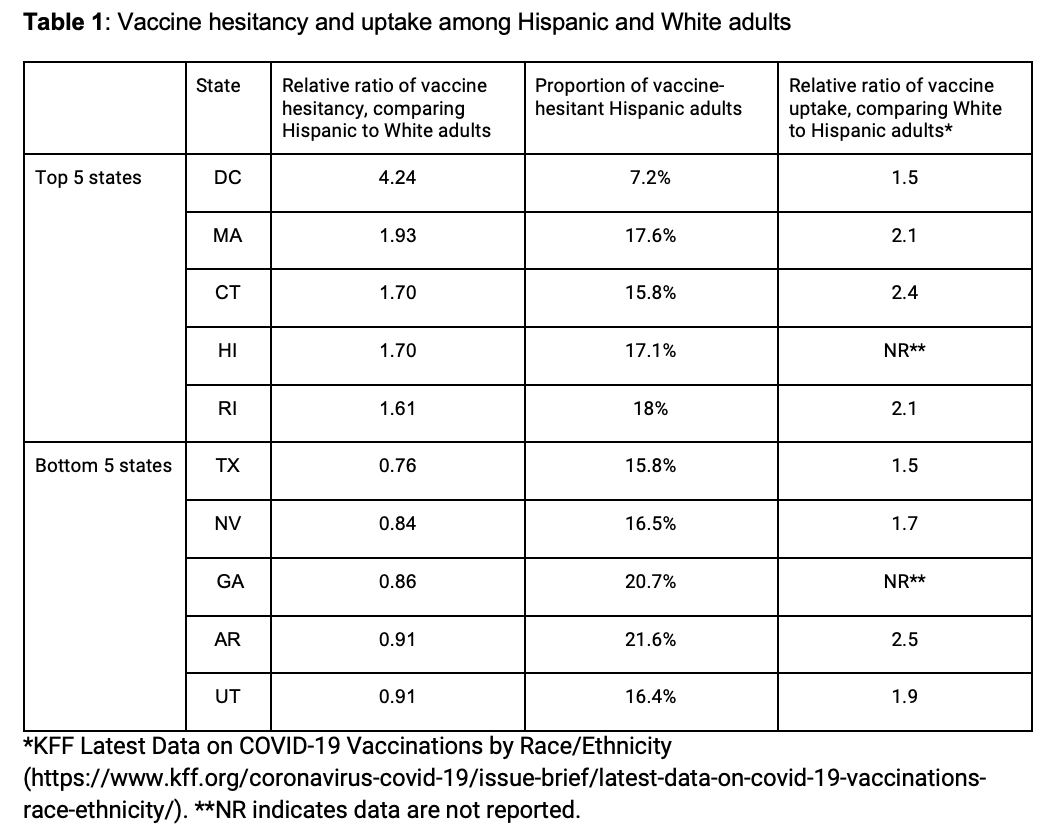
The top ten states with the largest disparity by Hispanic ethnicity are DC (4.3×), MA (1.9×), CT (1.7×), HI (1.7×), RI (1.6×), PA (1.4×), MI (1.3×), CO (1.3×), NJ (1.3×), and MT (1.3×) [Table 1].
Montana stands out in particular as a state with room for improvement because it also has the one of the highest vaccine hesitancy rates among the Hispanic population.
The large disparity in vaccine hesitancy observed in MA, CT, RI, PA, MI, and CO mirrors disparities in vaccine uptake. These states have one of the largest disparities in vaccination rates in the country (White-to-Hispanic vaccination rate ratios > 2.0 according to KFF), which suggests that addressing the disparity in hesitancy among unvaccinated adults may also help address the disparity in vaccine uptake between Hispanic and White adults.
The top ten states where Hispanic adults are less likely to be vaccine-hesitant compared to White adults are TX (0.76×), NV (0.84×), GA (0.86×), AR (0.91×), UT (0.91×), MO (0.92×), ID (0.92×), LA (0.93×), IL (0.93×), and IA (0.94×).
Arkansas and Iowa stand out in particular because these may be states where even though Hispanic adults are less hesitant, they may be having trouble making vaccination appointments. According to KFF, Arkansas and Iowa have one of the largest disparities in vaccination uptake between White and Hispanic adults (i.e., White adults are >2.5× more likely to get vaccinated than Hispanic adults), despite our data demonstrating that Hispanic adults are less vaccine-hesitant than White adults in these states. This suggests that there may be more barriers related to accessibility for Hispanic adults. As our data demonstrate in later sections of the report, Arkansas indeed has one of the states where Hispanic adults are much less likely to try to make an appointment.
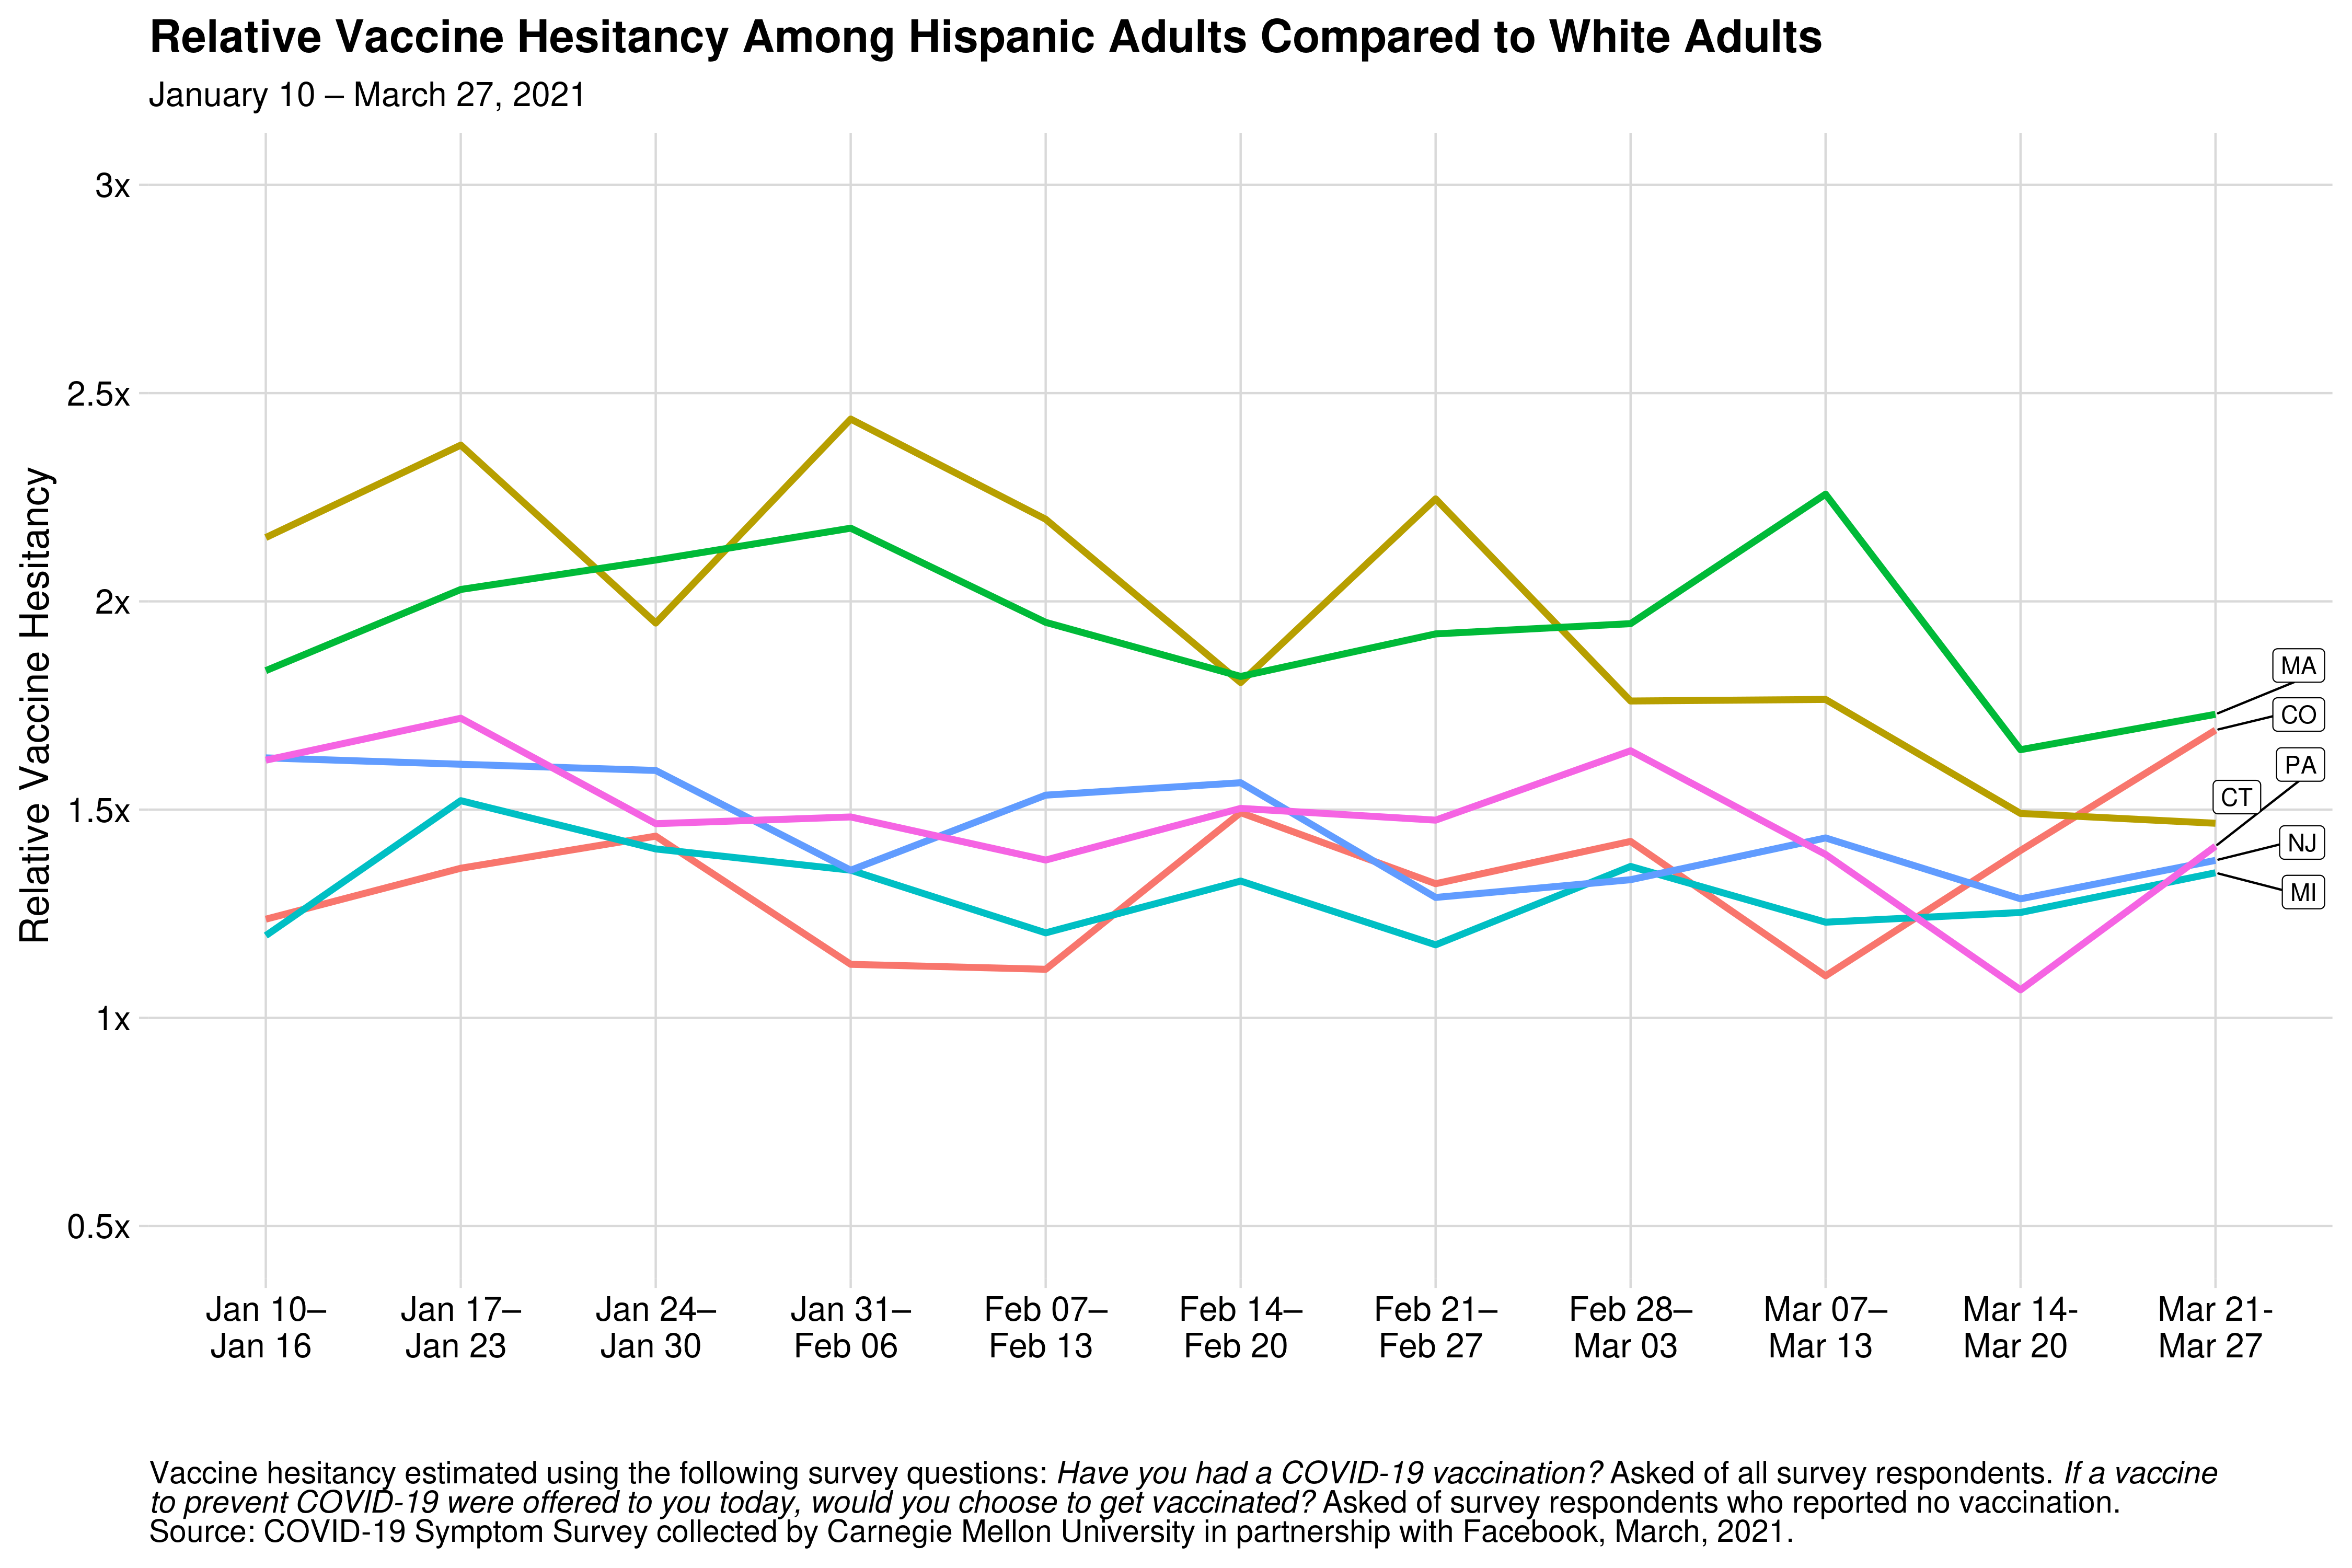
Fortunately, the disparity in vaccine hesitancy in many of these states (including MA, CO, PA, CT, NJ, and MI) is either decreasing or stable over time:
What causes the disparities?
Reasons for vaccine hesitancy
In states with the largest disparities in vaccine hesitancy between Hispanic and White adults (CO, CT, DC, HI, MA, MI, MT, NJ, PA, and RI), reasons for hesitancy among Hispanic adults are shown here:
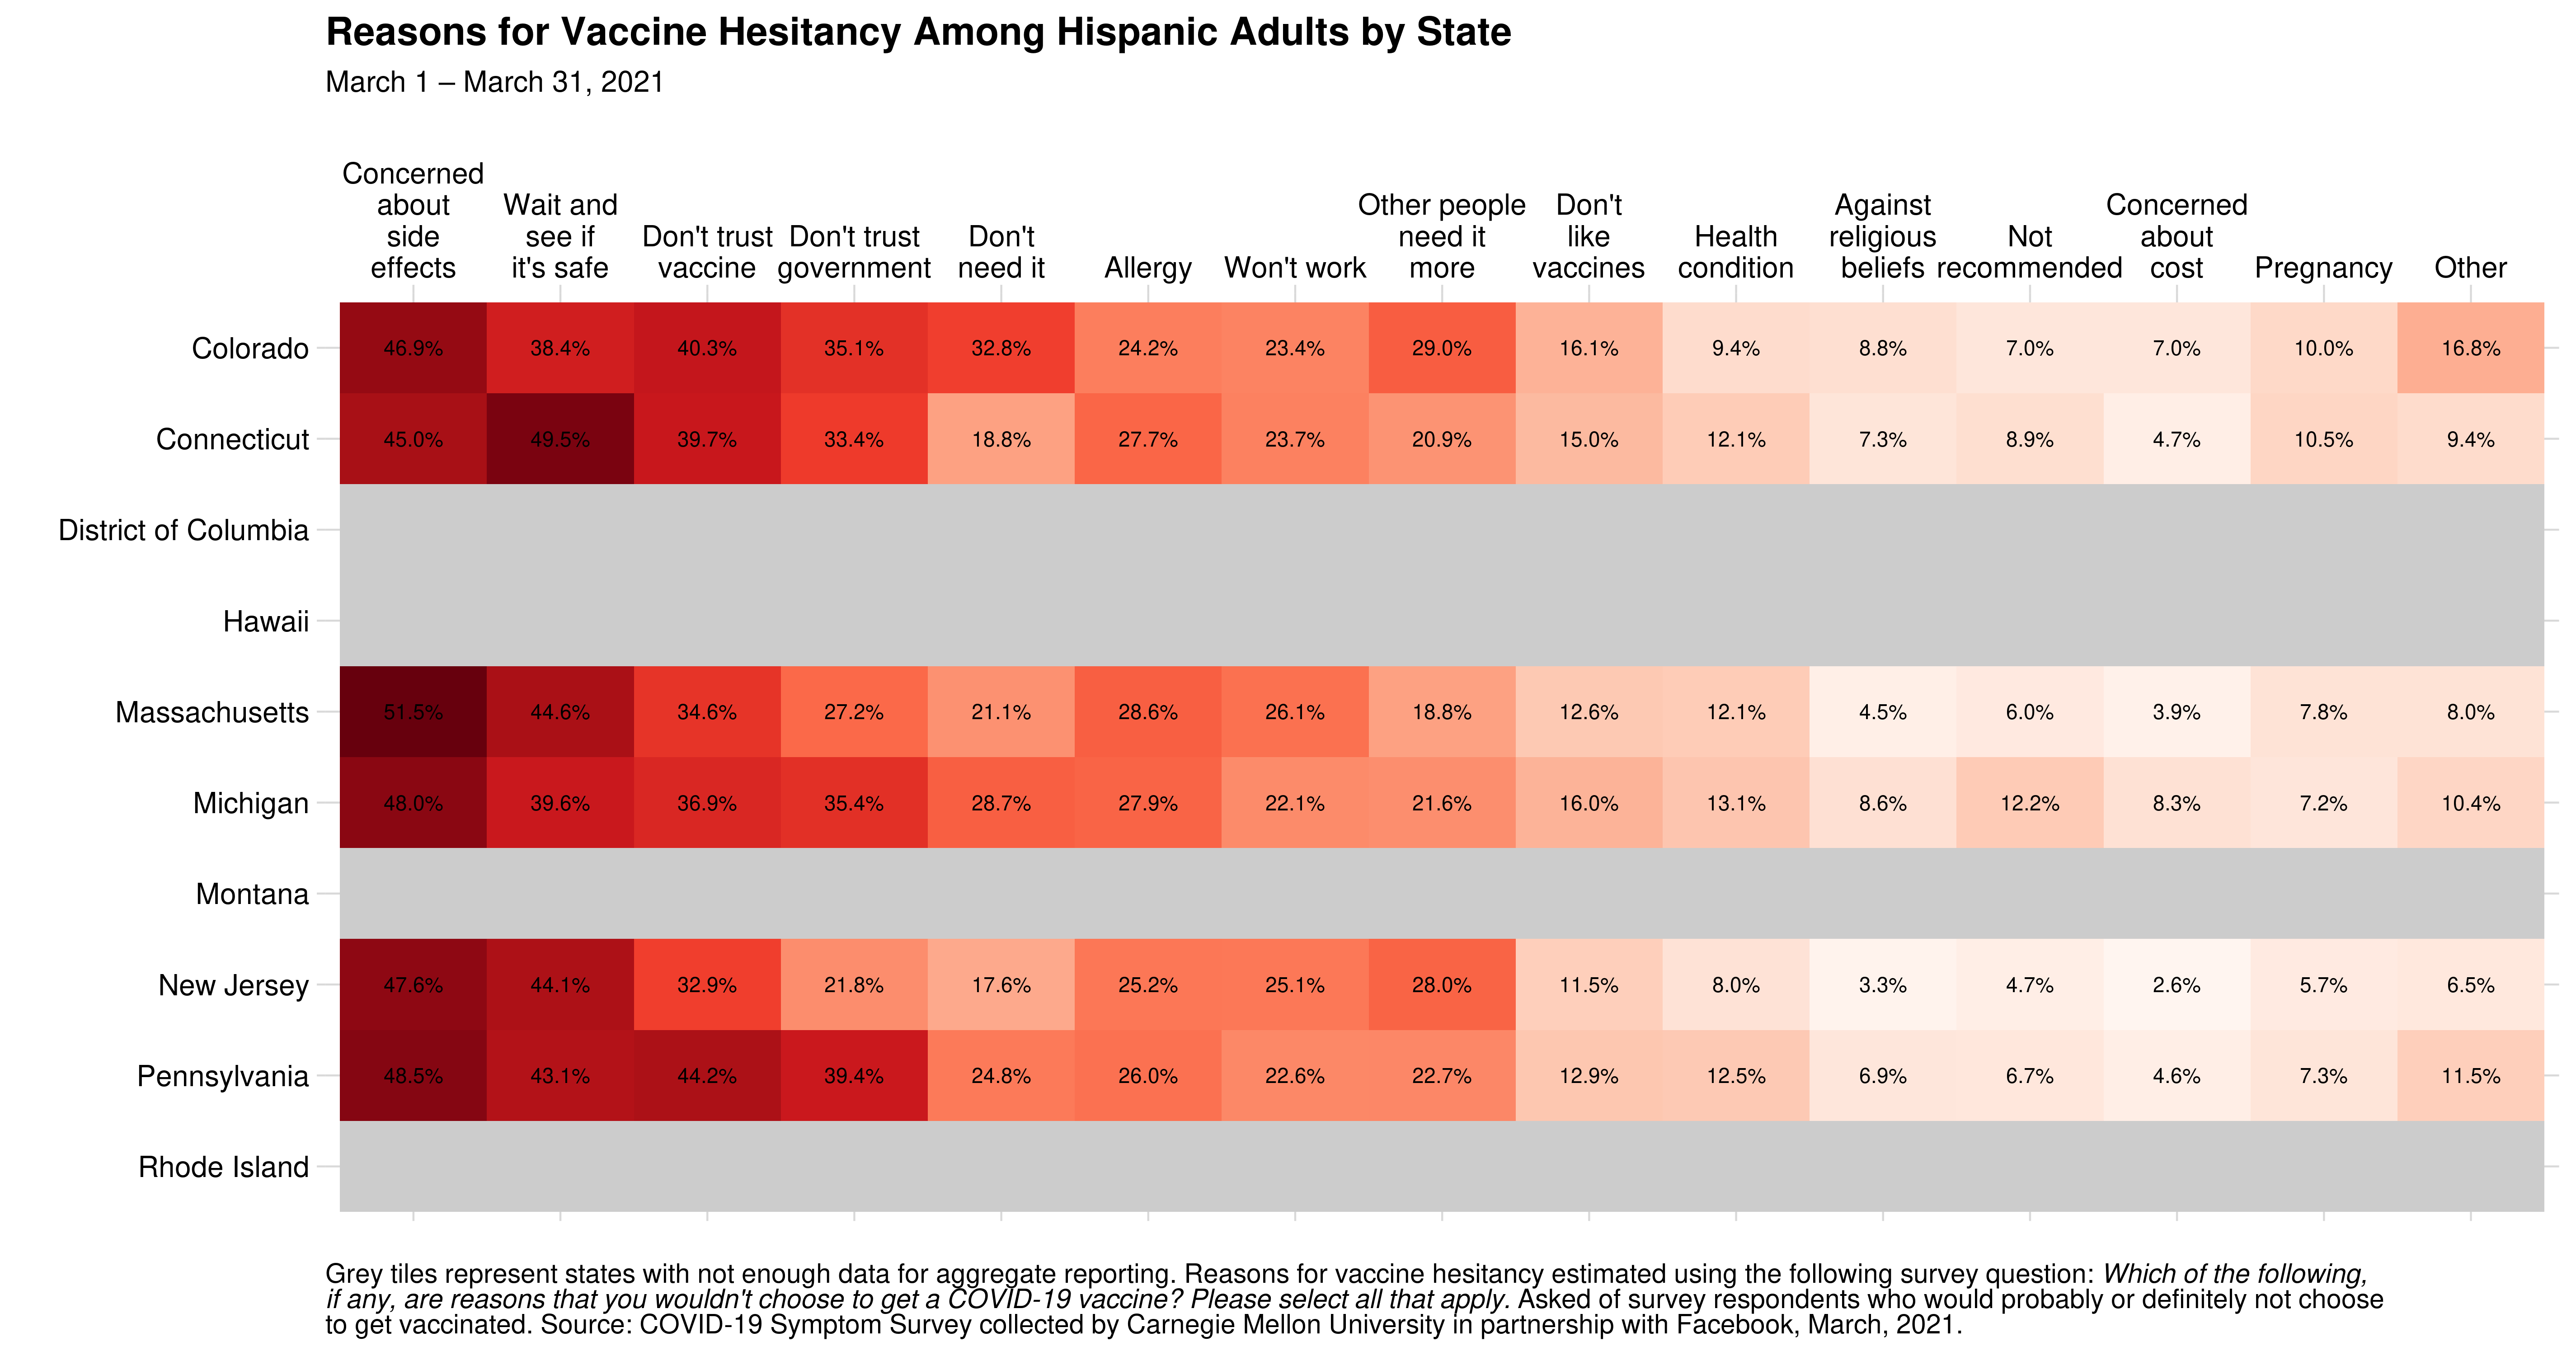
There seem to be several key groups of common reasons:
- Safety
- Concerns about side effects (45-52%)
- Wanting to wait and see if it’s safe (38-50%)
- Concerns about allergic reactions (24-29%)
- Lack of confidence
- Do not trust COVID-19 vaccines (33-44%)
- Do not trust government (22-39%)
- Do not think the vaccine will work (22-26%)
- Belief that they don’t need the vaccine (18-33%)
- Altruism (believing other people need it more) (19-29%)
We can also compare these reasons to White adults:
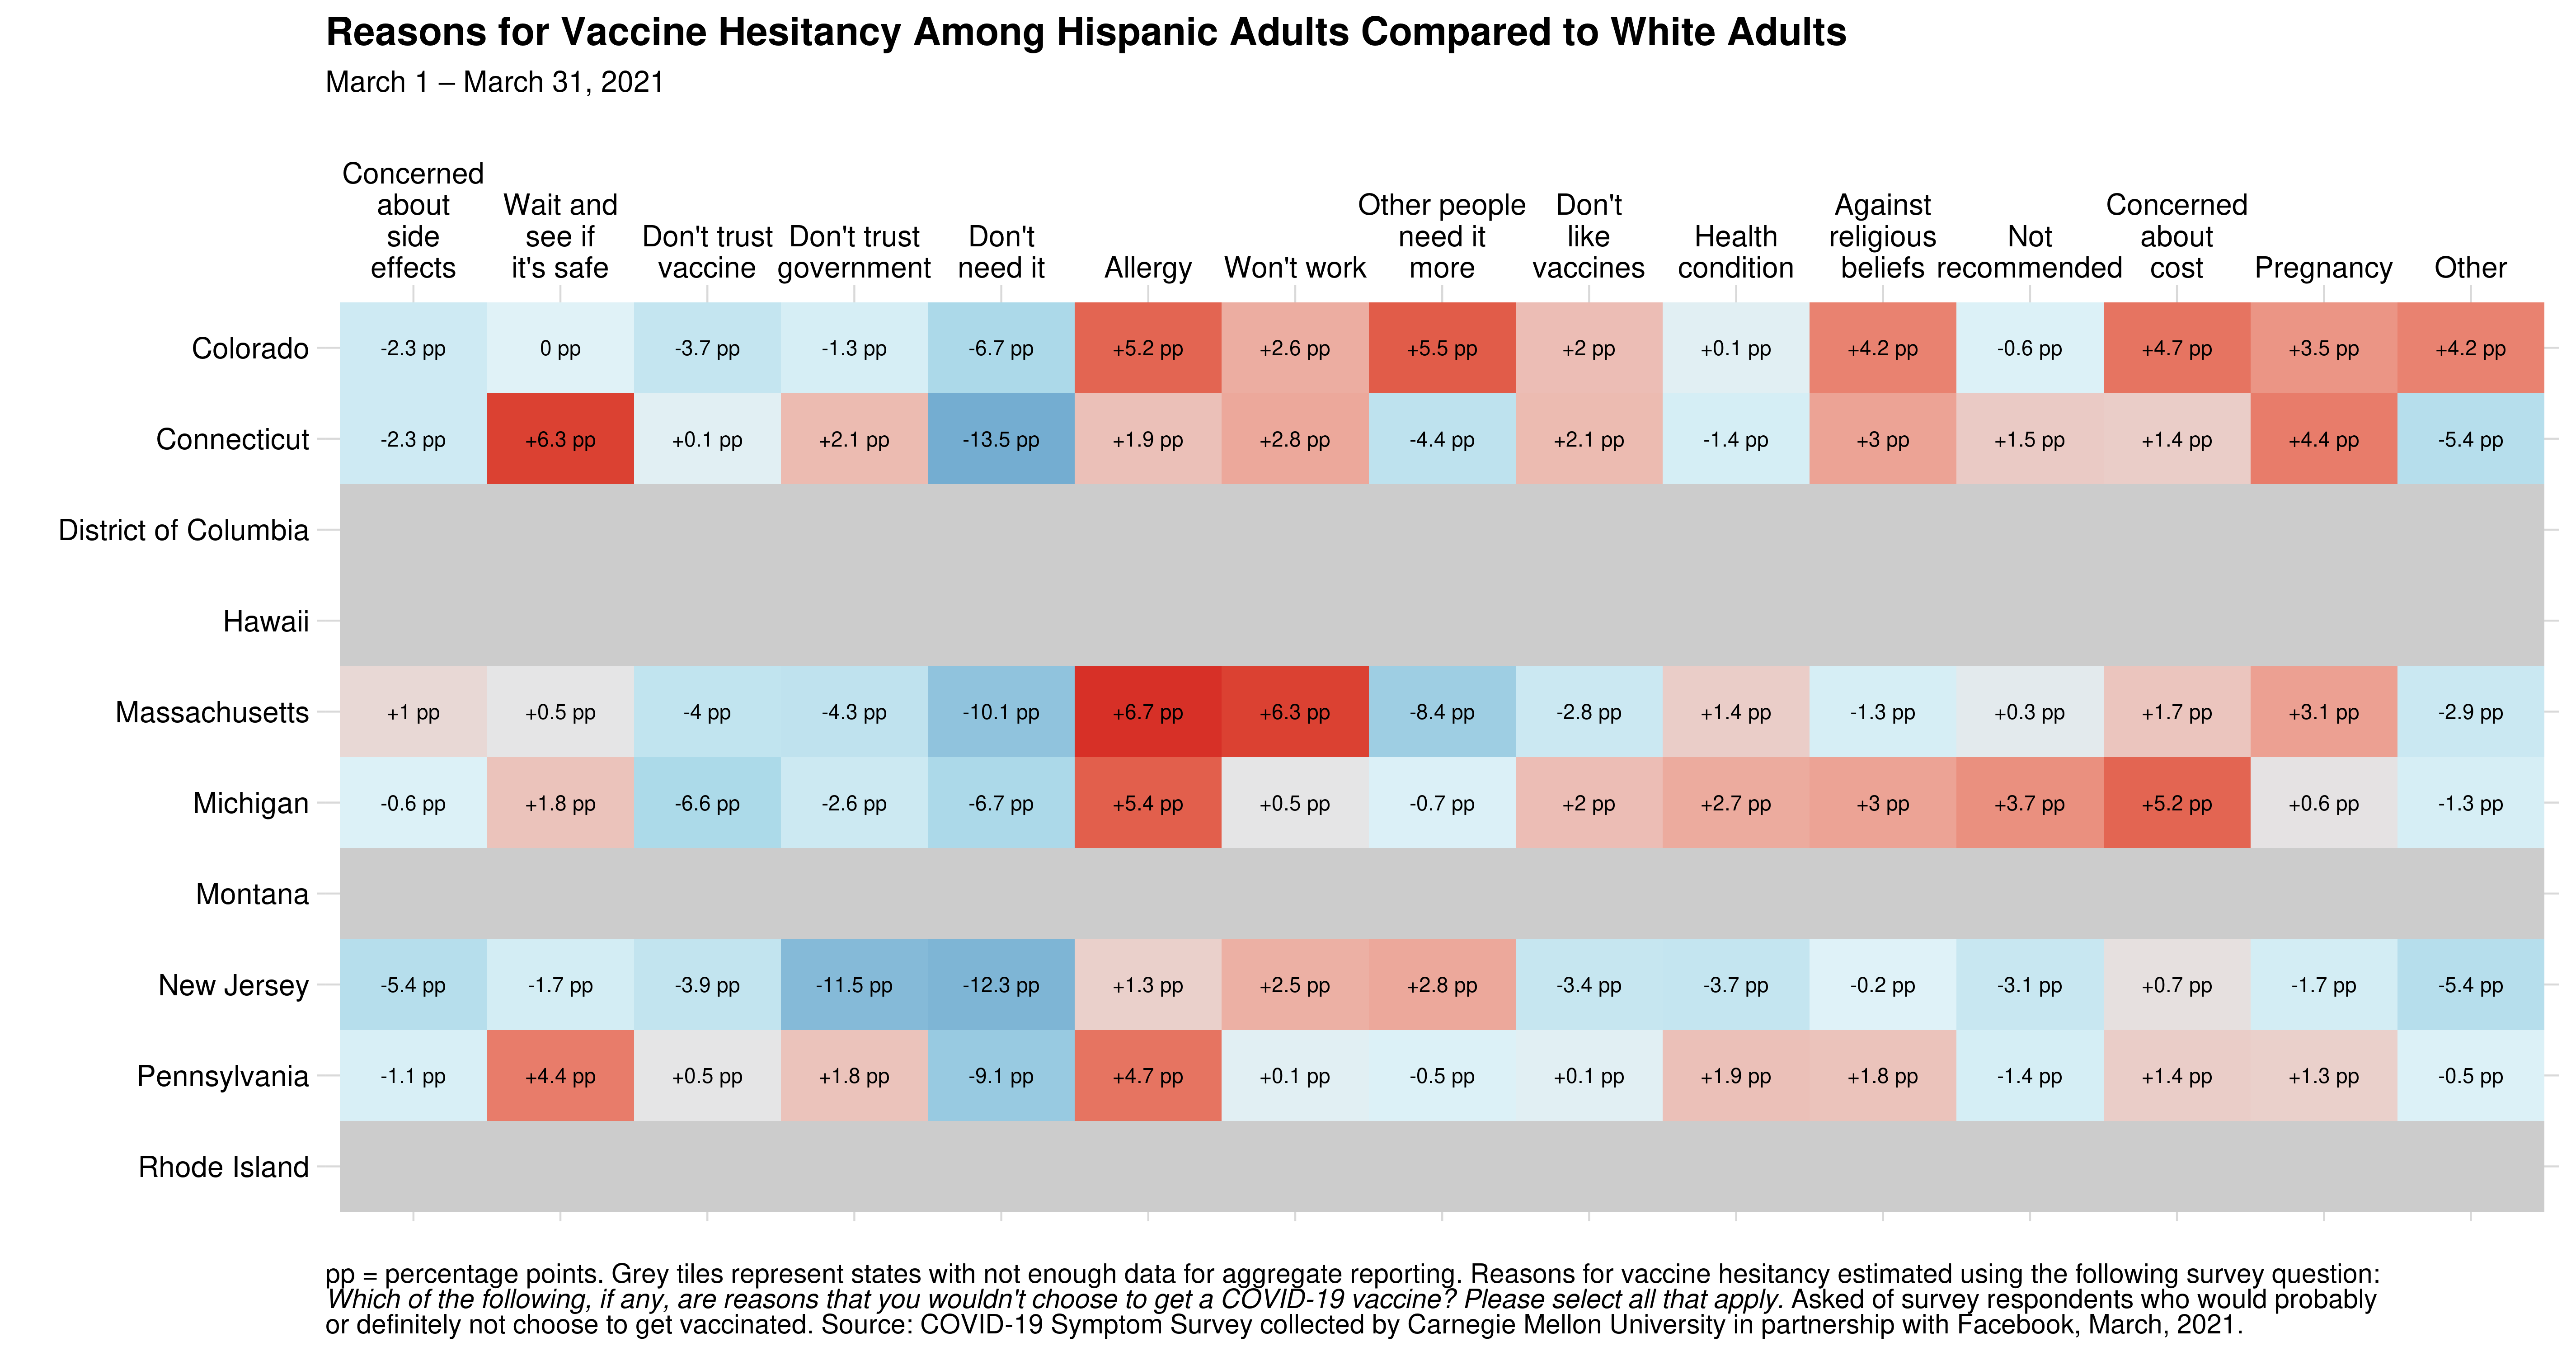
When compared to White adults, Hispanic adults are much more likely to indicate that the reasons for hesitancy are related to:
- Safety or health
- Concerns about allergy: CO (+5.2 percentage points [pp]), MA (+6.7pp), MI (+5.4pp), PA (+4.7pp), CT (+1.9pp), NJ (+1.3pp)
- Wanting to wait and see if it’s safe: CT (+6.3pp), PA (+4.4pp), MI (+1.8pp), MA (+0.5pp)
- Concerns related to pregnancy: CT (+4.4pp), CO (+3.5pp), MA (+3.1pp), PA (+1.3pp)
- Cost
- CO (+4.7pp), MI (+5.2pp), MA (+1.7pp), PA (+1.4pp), CT (+1.4pp), NJ (+0.7pp)
- Lack of confidence
- Do not think the vaccine will work: MA (+6.3pp), CT (+2.8pp), CO (+2.6pp), NJ (+2.5pp), MI (+0.5pp), PA (+0.1pp)
- Religious beliefs or altruism
- It is against their religious beliefs: CO (+4.2pp), CT (+3pp), MI (+3pp), PA (+1.8pp)
- They believe other people need it more: CO (+5.5pp), NJ (+2.8pp)
Feeling informed about how to get a vaccination
Feeling informed about how to get a vaccination among Hispanic adults varies significantly across states:
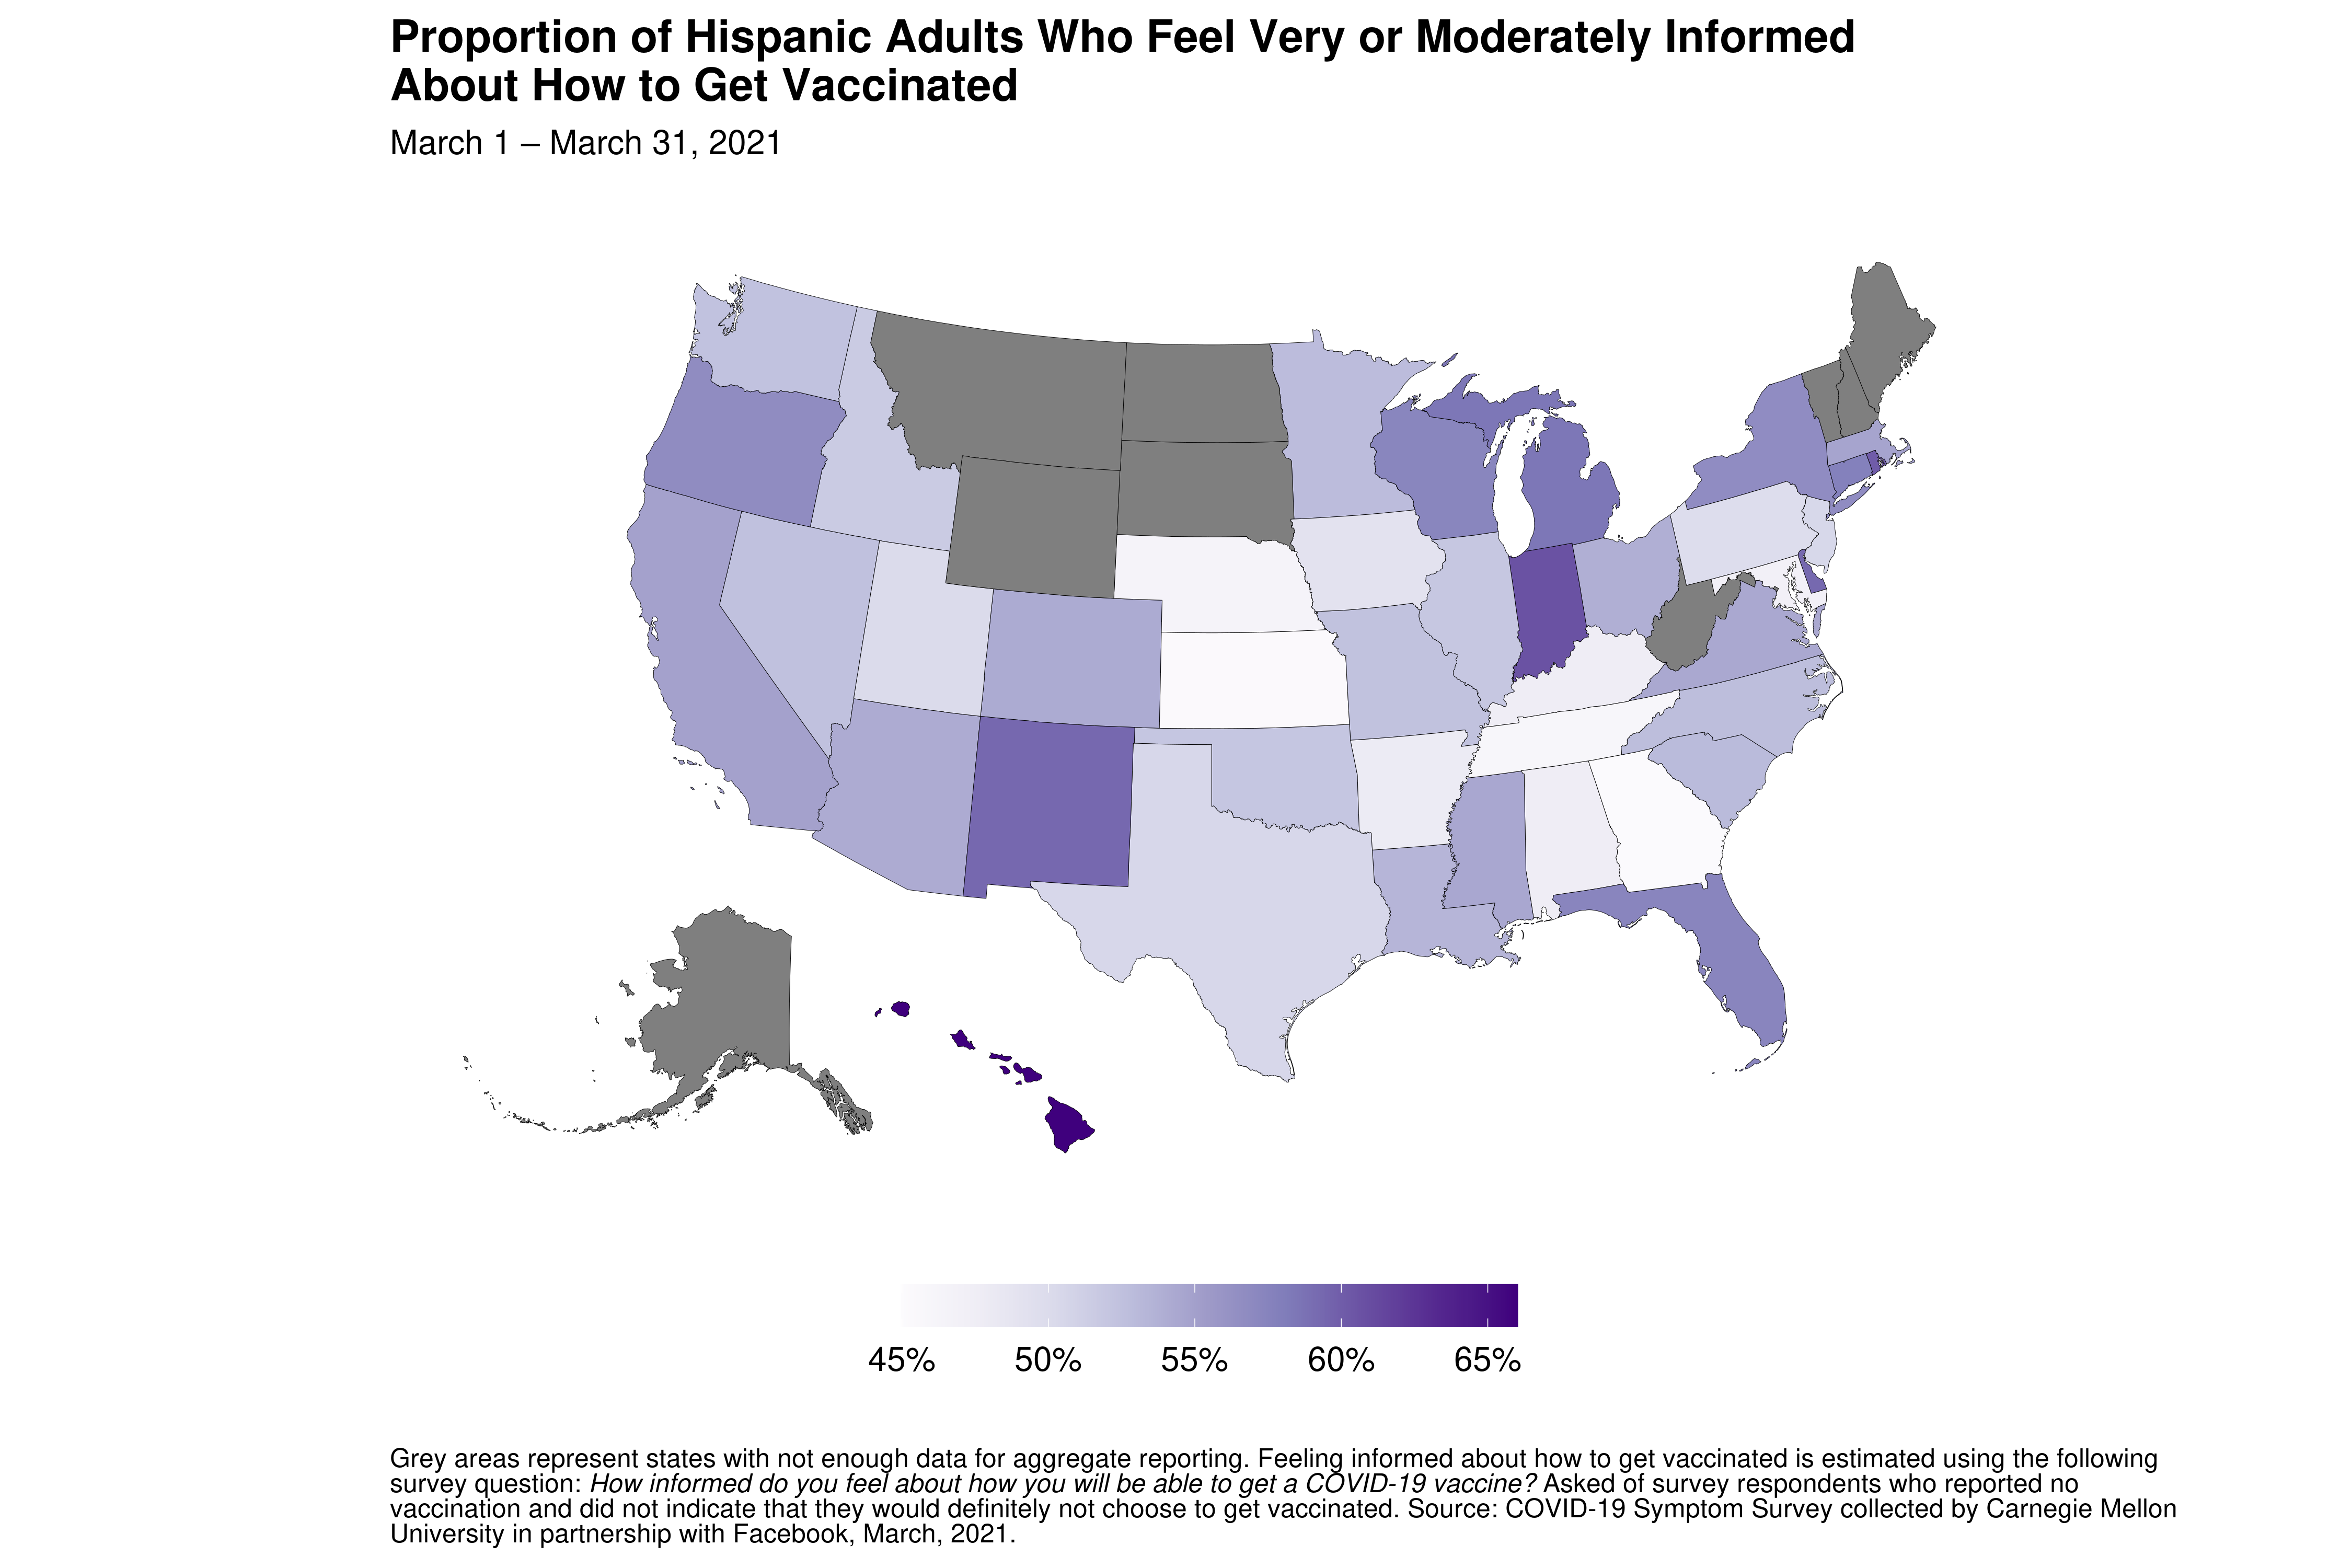
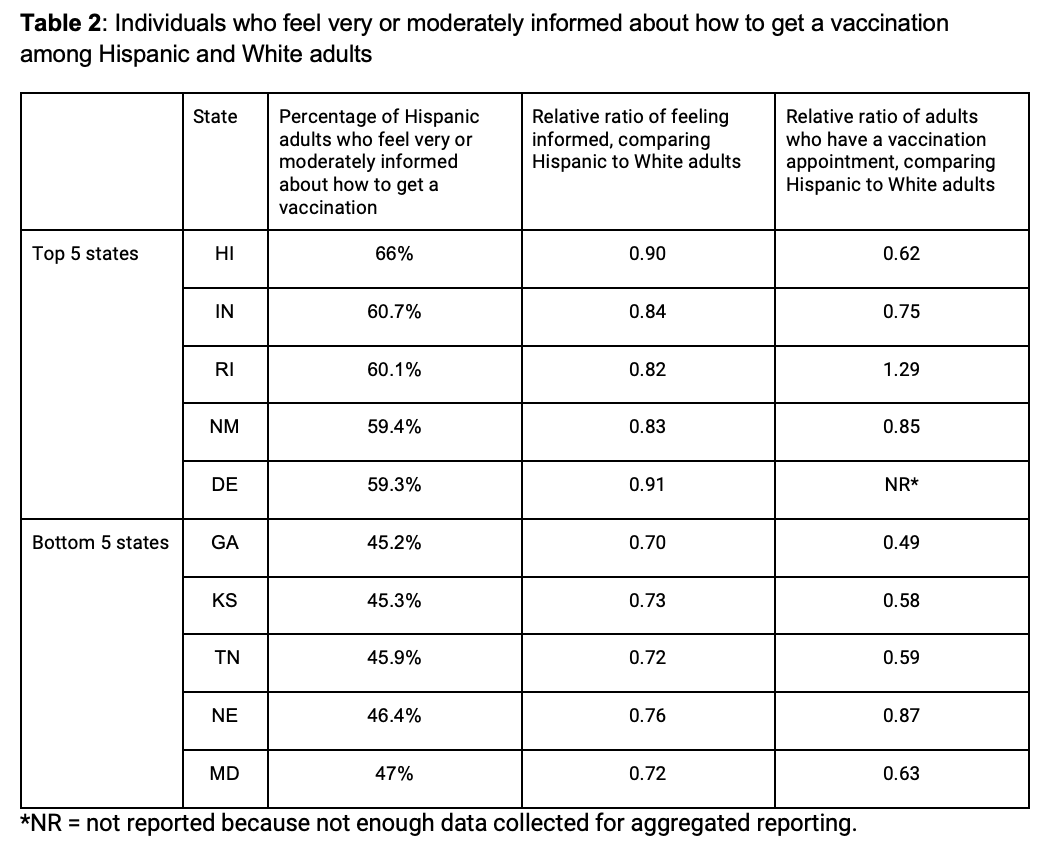
The top 5 states where Hispanic adults feel the most informed are HI (66% feel very or moderately informed), IN (60.7%), RI (60.1%), NM (59.4%), and DE (59.3%). The states where Hispanic adults feel the least informed are GA (45.2%), KS (45.3%), TN (45.9%), NE (46.4%), MD (47%):
Across all states, however, Hispanic adults report feeling less informed about getting a vaccination than White adults. Nationally, 53.5% of Hispanic adults report being very or moderately informed about how they will be able to get a COVID-19 vaccination, compared to 66% of non-Hispanic white adults.
The largest disparities by Hispanic ethnicity are also observed mostly in states where Hispanic adults feel the least informed: GA (0.7×), MD (0.72×), TN (0.72×), and KS (0.73×).
The states with the largest disparities by Hispanic ethnicity are also where Hispanic adults were much less likely than White adults to try to make a vaccination appointment, suggesting that an information gap may contribute to disparities in making appointments to receive a vaccination.
In GA, KS, and CT, Hispanic adults feel less informed than White adults (0.7× in GA, 0.73× in KS, 0.74× in CT), and they are also much less likely to have tried to make a vaccination appointment (0.49× in GA, 0.58× in KS, 0.53× in CT).
Having a vaccination appointment and trying to make an appointment
Nationally, the proportion of unvaccinated vaccine-accepting Hispanic adults who currently have an appointment to get a vaccination (9.4%) is much lower than for White adults (15.7%). There is, however, significant disparity by state:
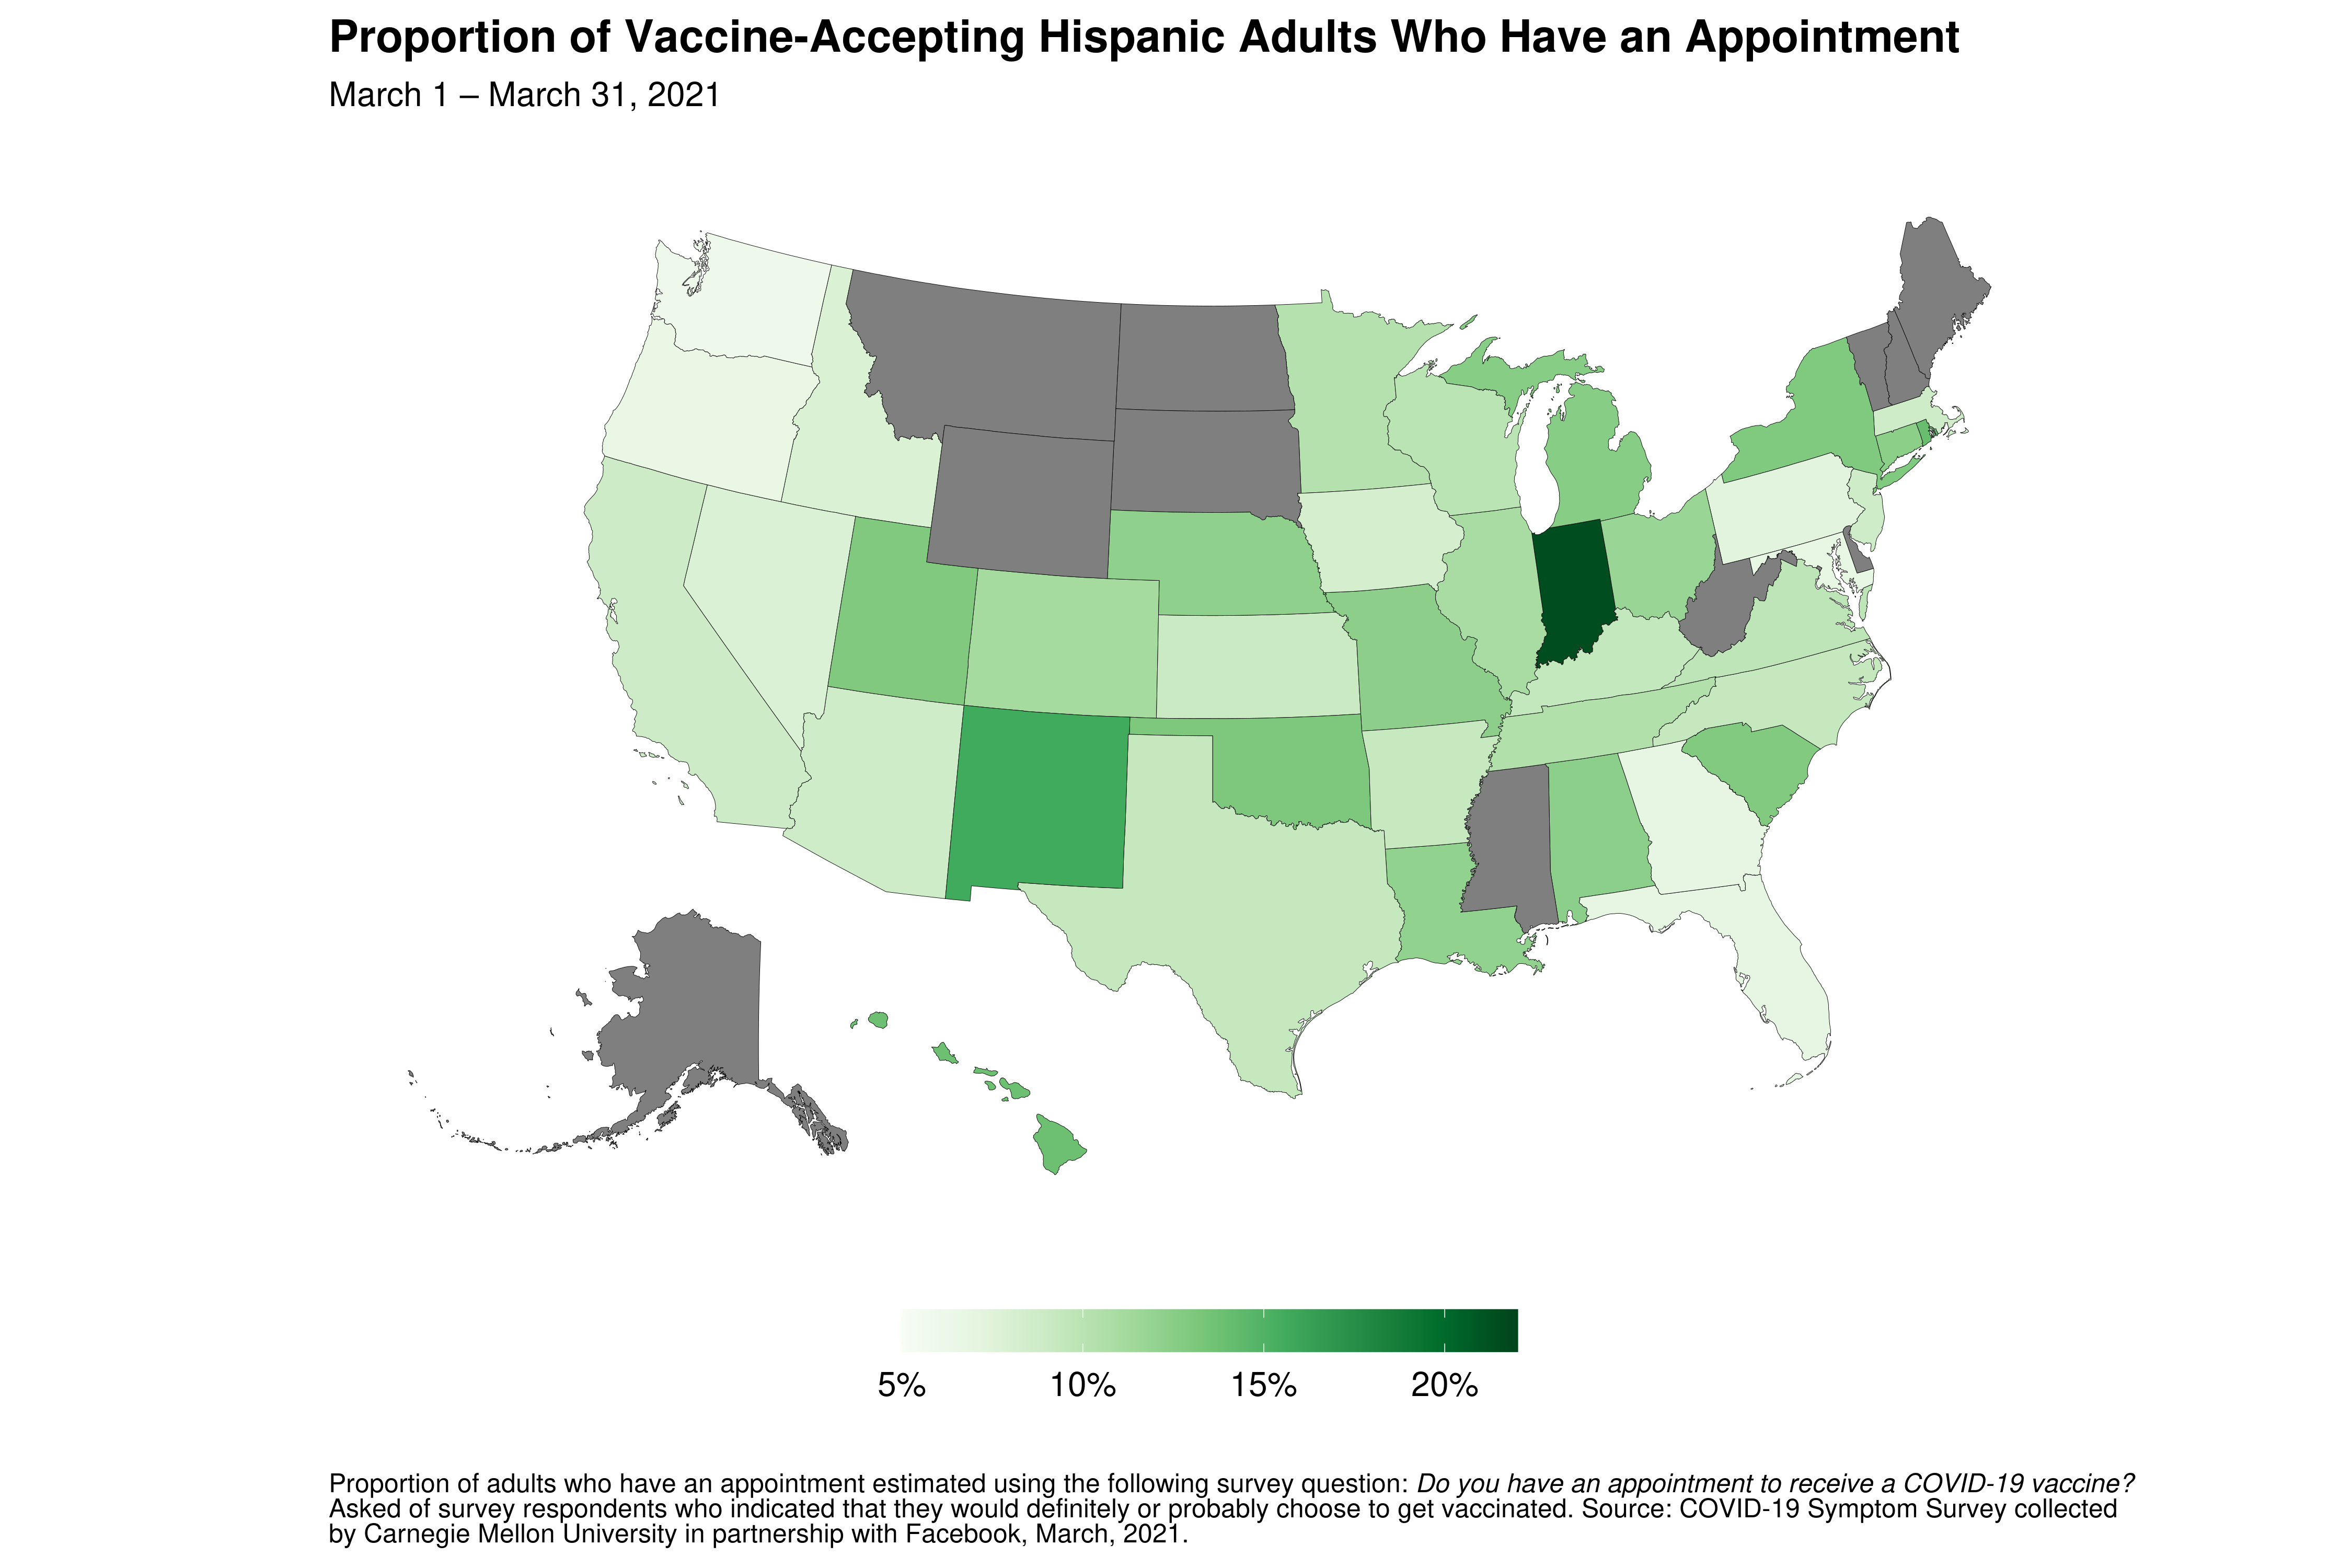
The top 5 states with the lowest proportion of Hispanic adults who have an appointment are WA (6%), OR (6.6%), MD (6.7%), GA (6.9%), and FL (7%):
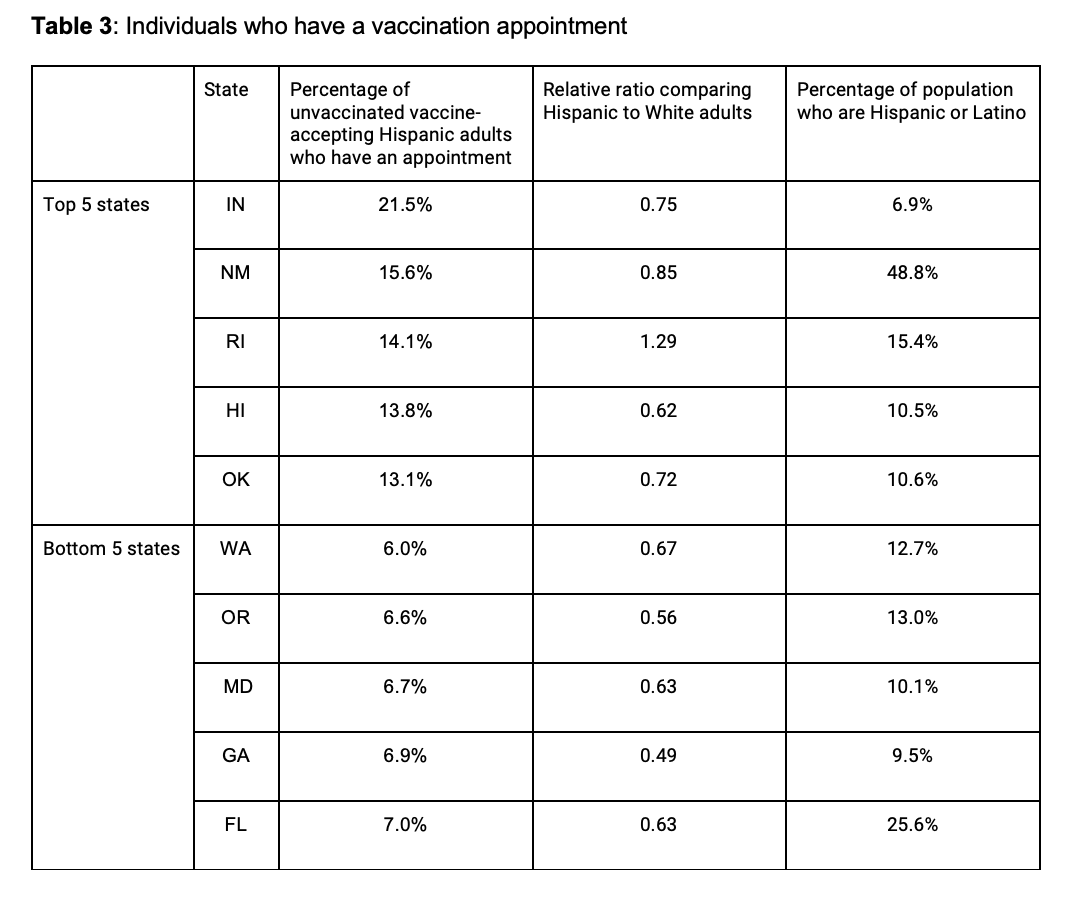
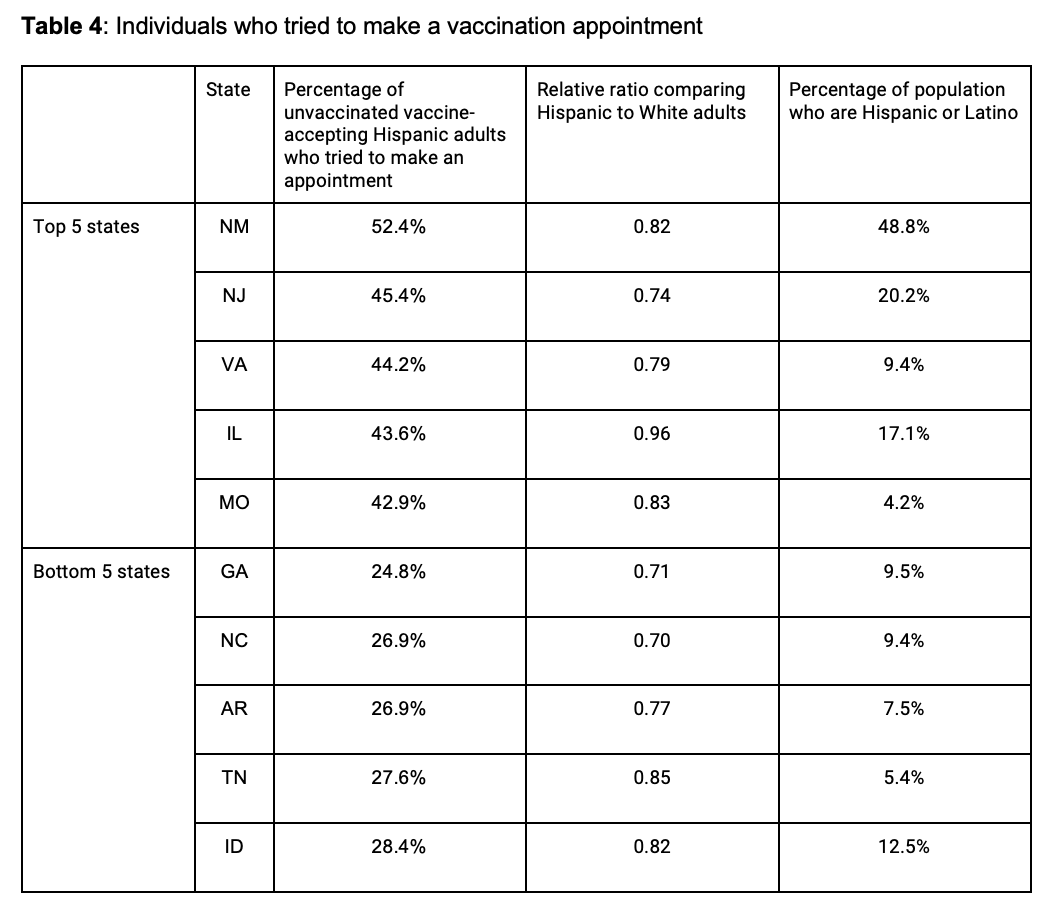
GA stands out because it also has the lowest proportion of Hispanic adults who tried to make an appointment (24.8% compared to the national average of 31.8%), and Hispanic adults were much less likely to try than White adults (0.71×). This suggests that addressing vaccine hesitancy alone will not be sufficient to eliminate disparities in uptake between Hispanic and White adults, and that other approaches such as increasing availability of information about how to get a vaccine may be necessary.
Similar to GA, NC had one of the lowest proportion of Hispanic adults who tried to make an appointment (26.9%) and Hispanic adults were much less likely to try than White adults (0.7×). This suggests that in addition to the information gap as noted above, immigration status may also be a barrier, as these states have some of the largest unauthorized immigrant populations in the US according to the DHS.
The top 5 states with the highest proportion of Hispanic adults who have an appointment to get a vaccination are IN (21.5%), NM (15.6%), RI (14.1%), HI (13.8%), and OK (13.1%).
RI stands out as a state where Hispanic adults are also more likely to have appointments than White adults (1.29×).
NM stands out as a state that has the highest proportion of Hispanic adults who also tried to make an appointment (52.4% compared to the national average of 31.8%).
Conclusion
This analysis illustrates the type of detailed geographic and demographic breakdowns that the COVID Symptom Survey makes possible, as well as the current challenges facing the COVID-19 vaccination effort in the United States.
It’s important to keep the survey’s limitations in mind. The Symptom Survey weighted population estimates for characteristics such as age, gender, and certain chronic conditions are generally comparable to estimates from other data sources at both the national and state level. However, our survey population may still over- or under-represent certain subpopulations or characteristics related to education, race, and occupation because we do not account for these characteristics in the weighting of our survey responses. In particular, the weighted sample is slightly under-representative of low-education adults as well as Black or African American and Hispanic adults.
For more information, detailed documentation about the survey, procedures, questionnaire, and aggregate data is available on our survey documentation site. Academic and nonprofit researchers can request access to the non-public non-aggregated data for their research.


